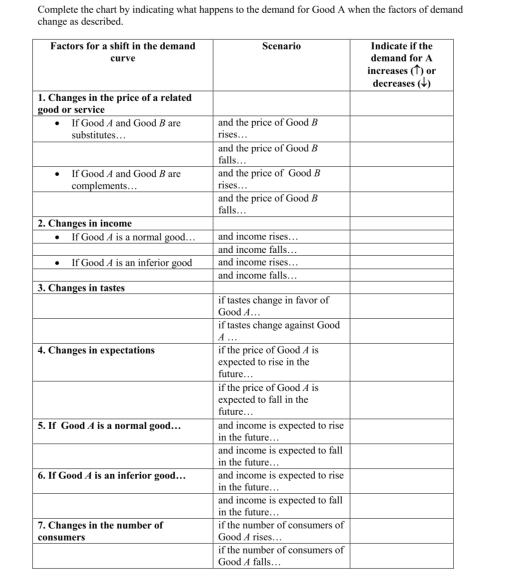
Complete the chart by indicating what happens to the demand for Good A when the factors of demand change as described. Factors for a

Complete the chart by indicating what happens to the demand for Good A when the factors of demand change as described. Factors for a shift in the demand curve 1. Changes in the price of a related good or service If Good A and Good B are substitutes... If Good A and Good B are complements... 2. Changes in income If Good 4 is a normal good... If Good A is an inferior good 3. Changes in tastes 4. Changes in expectations 5. If Good 4 is a normal good... 6. If Good 4 is an inferior good... 7. Changes in the number of consumers Scenario and the price of Good B rises... and the price of Good B falls... and the price of Good B rises... and the price of Good B falls... and income rises... and income falls... and income rises... and income falls.... if tastes change in favor of Good A... if tastes change against Good A... if the price of Good A is expected to rise in the future... if the price of Good 4 is expected to fall in the future... and income is expected to rise the future... and income is expected to fall in the future... and income is expected to rise in the future... and income is expected to fall in the future... if the number of consumers of Good A rises... if the number of consumers of Good A falls... Indicate if the demand for A increases (1) or decreases (4)
Step by Step Solution
3.40 Rating (141 Votes )
There are 3 Steps involved in it
Step: 1
The table shows how different factors can affect the demand for good ALets go through each factor one by one 1 Changes in the price of a related good or service If Good A and Good B are substitutes an...
See step-by-step solutions with expert insights and AI powered tools for academic success
Step: 2

Step: 3

Ace Your Homework with AI
Get the answers you need in no time with our AI-driven, step-by-step assistance
Get Started


