

Answered step by step
Verified Expert Solution
Question
1 Approved Answer
Complete the common-size income statement for the year ending December 31,2019 and compare it to the common-size income statement for the year ending December 2018:

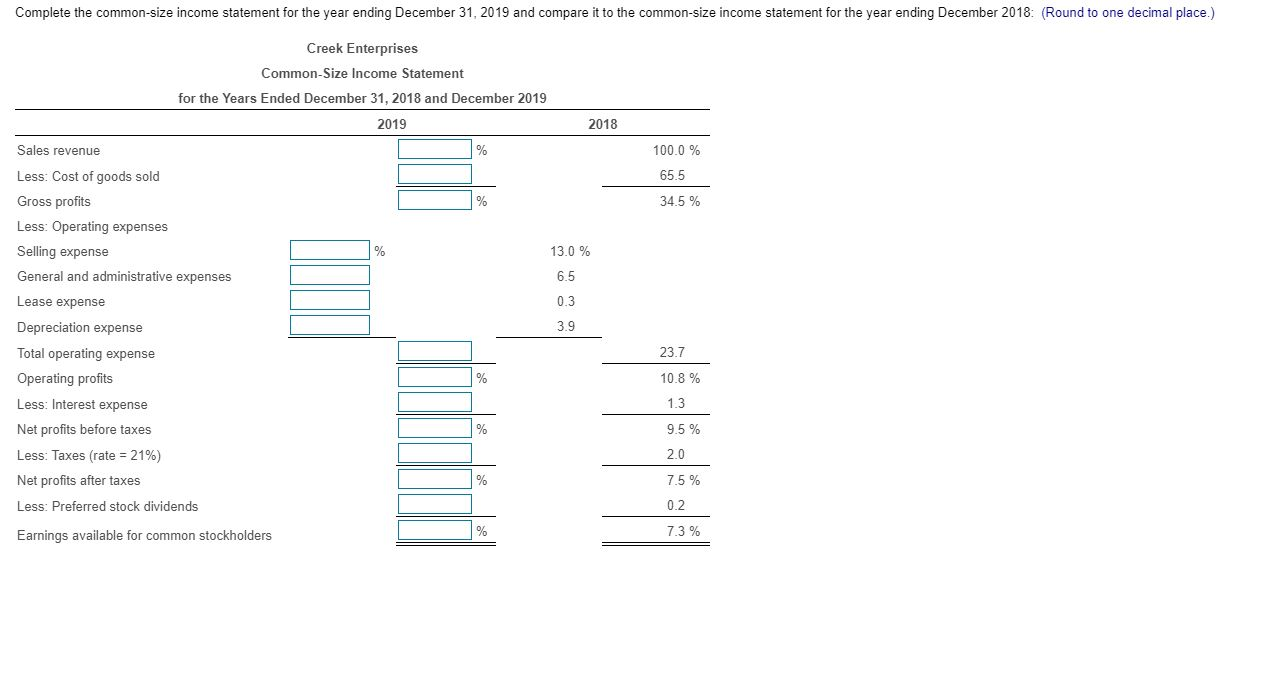
Complete the common-size income statement for the year ending December 31,2019
and compare it to the common-size income statement for the year ending December 2018:
(Round to one decimal place.)
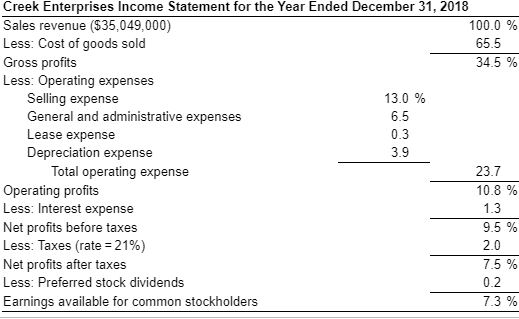
Creek Enterprises Income Statement for the Year Ended December 31, 2018 Sales revenue ($35,049,000) 100.0 % Less: Cost of goods sold 65.5 Gross profits 34.5 % Less: Operating expenses Selling expense 13.0 % General and administrative expenses 6.5 Lease expense Depreciation expense Total operating expense Operating profits 10.8 % Less: Interest expense 1.3 Net profits before taxes 9.5 % Less: Taxes (rate=21%) 20 Net profits after taxes Less: Preferred stock dividends 0.2 Earnings available for common stockholders 7.3 % 0.3 3.9 23.7 7.5 % Creek Enterprises Income Statement for the Year Ended December 31, 2018 Sales revenue ($35,049,000) 100.0 % Less: Cost of goods sold 65.5 Gross profits 34.5 % Less: Operating expenses Selling expense 13.0 % General and administrative expenses 6.5 Lease expense Depreciation expense Total operating expense Operating profits 10.8 % Less: Interest expense 1.3 Net profits before taxes 9.5 % Less: Taxes (rate=21%) 20 Net profits after taxes Less: Preferred stock dividends 0.2 Earnings available for common stockholders 7.3 % 0.3 3.9 23.7 7.5 % Complete the common-size income statement for the year ending December 31, 2019 and compare it to the common-size income statement for the year ending December 2018: (Round to one decimal place.) Creek Enterprises Common-Size Income Statement for the Years Ended December 31, 2018 and December 2019 2019 2018 100.0 % 65.5 34.5 % Sales revenue Less: Cost of goods sold Gross profits Less: Operating expenses Selling expense General and administrative expenses 13.0 % 6.5 0.3 3.9 Lease expense Depreciation expense Total operating expense Operating profits Less: Interest expense Net profits before taxes Less: Taxes (rate = 21%) Net profits after taxes Less: Preferred stock dividends 23.7 10.8 % 1.3 9.5% 2.0 7.5 % 0.2 7.3 % Earnings available for common stockholders Creek Enterprises Income Statement for the Year Ended December 31, 2018 Sales revenue ($35,049,000) 100.0 % Less: Cost of goods sold 65.5 Gross profits 34.5 % Less: Operating expenses Selling expense 13.0 % General and administrative expenses 6.5 Lease expense Depreciation expense Total operating expense Operating profits 10.8 % Less: Interest expense 1.3 Net profits before taxes 9.5 % Less: Taxes (rate=21%) 20 Net profits after taxes Less: Preferred stock dividends 0.2 Earnings available for common stockholders 7.3 % 0.3 3.9 23.7 7.5 % Creek Enterprises Income Statement for the Year Ended December 31, 2018 Sales revenue ($35,049,000) 100.0 % Less: Cost of goods sold 65.5 Gross profits 34.5 % Less: Operating expenses Selling expense 13.0 % General and administrative expenses 6.5 Lease expense Depreciation expense Total operating expense Operating profits 10.8 % Less: Interest expense 1.3 Net profits before taxes 9.5 % Less: Taxes (rate=21%) 20 Net profits after taxes Less: Preferred stock dividends 0.2 Earnings available for common stockholders 7.3 % 0.3 3.9 23.7 7.5 % Complete the common-size income statement for the year ending December 31, 2019 and compare it to the common-size income statement for the year ending December 2018: (Round to one decimal place.) Creek Enterprises Common-Size Income Statement for the Years Ended December 31, 2018 and December 2019 2019 2018 100.0 % 65.5 34.5 % Sales revenue Less: Cost of goods sold Gross profits Less: Operating expenses Selling expense General and administrative expenses 13.0 % 6.5 0.3 3.9 Lease expense Depreciation expense Total operating expense Operating profits Less: Interest expense Net profits before taxes Less: Taxes (rate = 21%) Net profits after taxes Less: Preferred stock dividends 23.7 10.8 % 1.3 9.5% 2.0 7.5 % 0.2 7.3 % Earnings available for common stockholdersStep by Step Solution
There are 3 Steps involved in it
Step: 1

Get Instant Access to Expert-Tailored Solutions
See step-by-step solutions with expert insights and AI powered tools for academic success
Step: 2

Step: 3
Ace Your Homework with AI
Get the answers you need in no time with our AI-driven, step-by-step assistance
Get Started
Public Finance An International Perspective
Authors: Joshua E. Greene
1st Edition
9814365041, 978-9814365048