

Question
Complete the following 7 steps, in order. 1. Calculate the book value cost of capital. Show your calculations in your submission and explain why you
Complete the following 7 steps, in order.
1. Calculate the book value cost of capital. Show your calculations in your submission and explain why you used the values you did.
2. Calculate the market value cost of capital. Show your calculations in your submission and explain why you used the values you did.
3. Evaluate the calculation Joanna did. If you disagree with any aspects of her methodology, explain why you do.
4. Which calculation, book value or market value, is relevant to this case? Explain your choice.
5. Explain under what circumstances the book value cost of capital should be used. Explain why you answered as you did.
6. Explain under what circumstances the market value cost of capital should be used. Explain why you answered as you did.
7. Provide your recommendation to Kimi Ford and explain your reasoning.
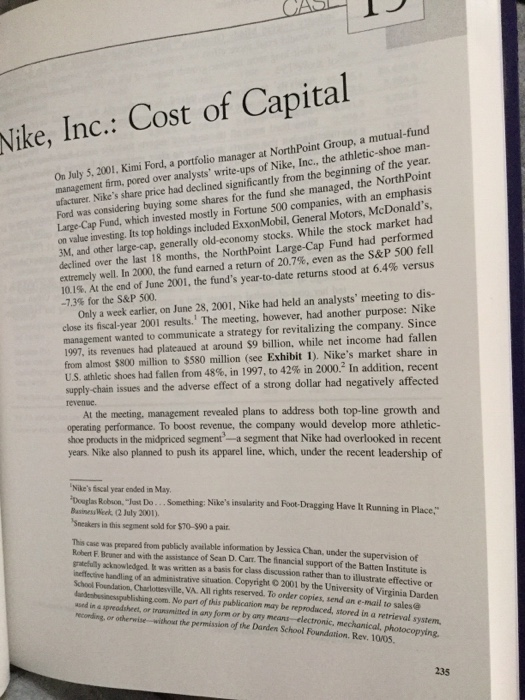
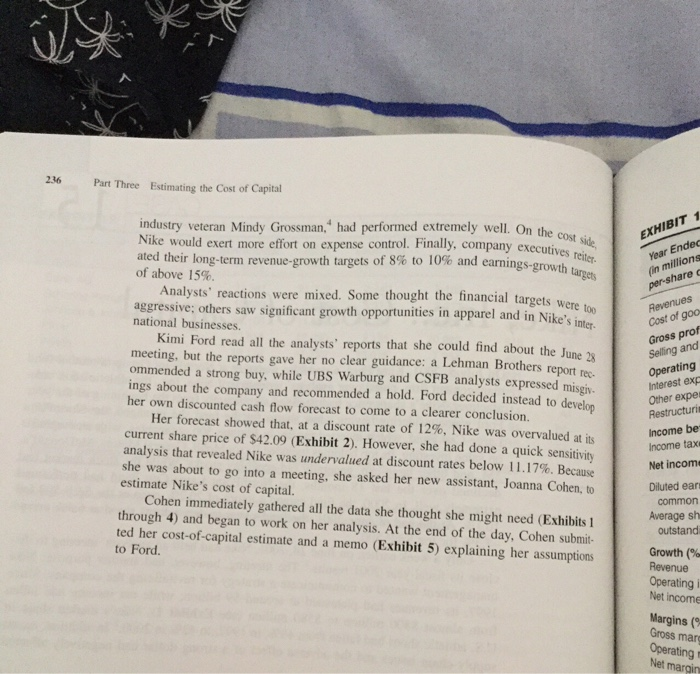
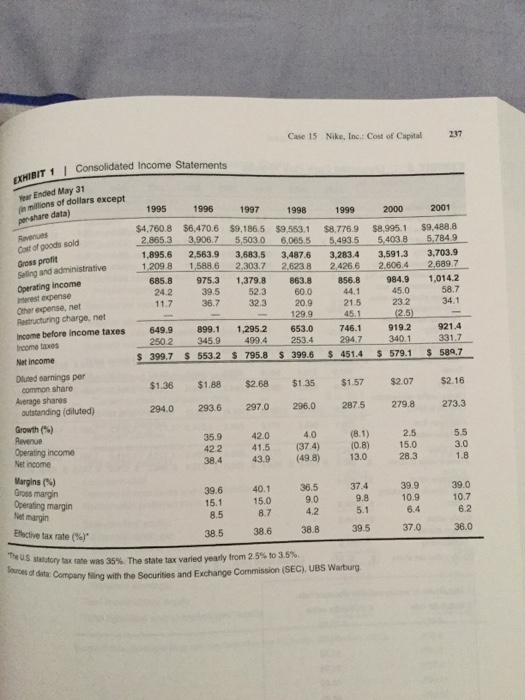
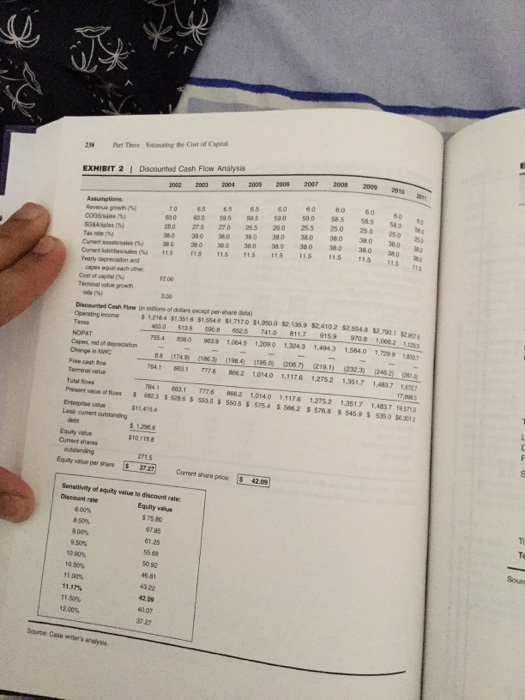
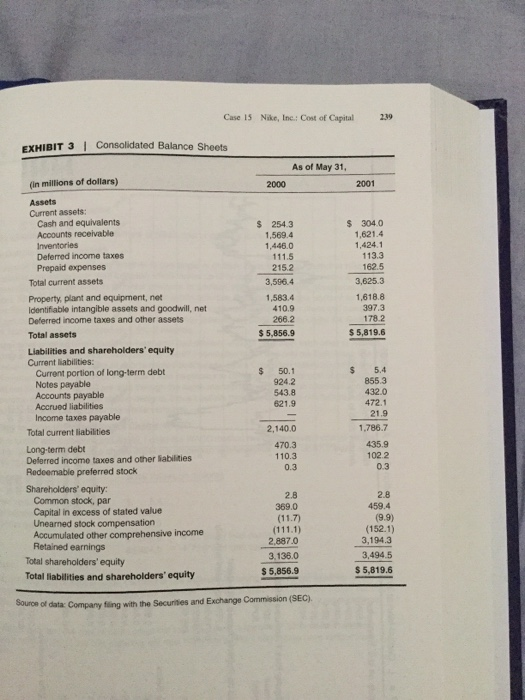
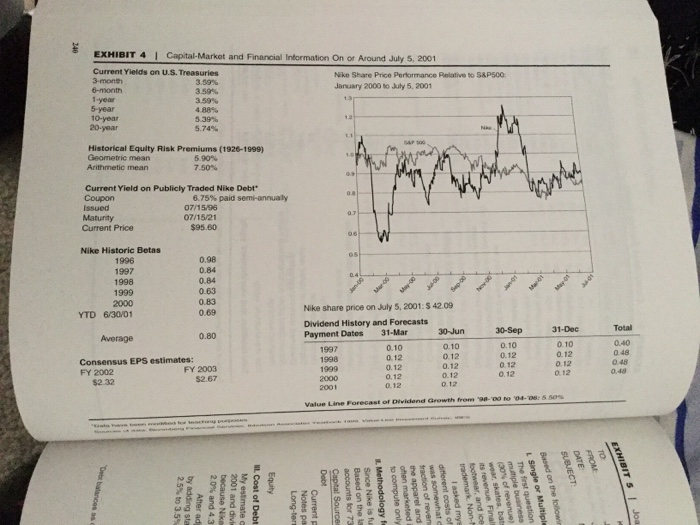
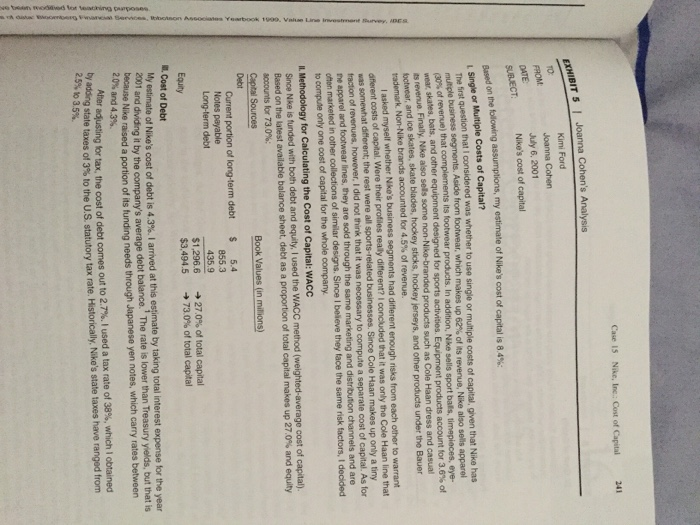
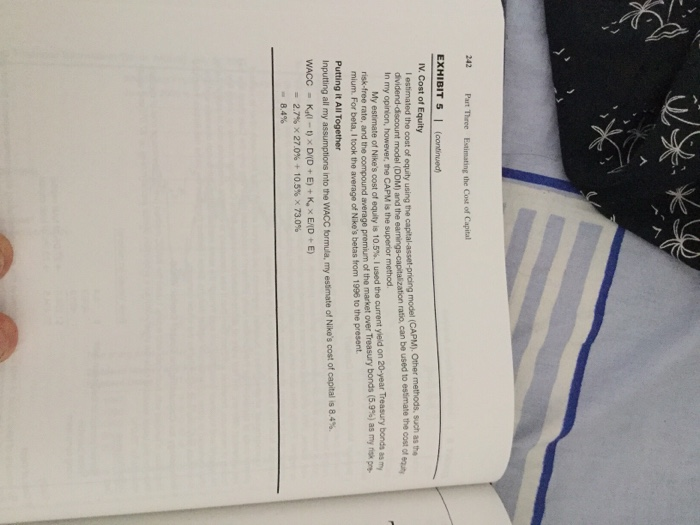
236 Part Three Estimating the Cost of Capital indistry veecan Mindy Grosman- ad pertomed etremely well On the eiEXHIBIT 1 Year Endec Nike would exert more effort on expense control. Finally, company executi ated their long-term revenue-growth targets of 8% to 10% and earnings of above 15%. ves reiter in millions Analysts' reactions were mixed. Some thought the financial t argets were ton aggressive: others saw significant growth opportunities in apparel and in Nike's inter Revenues Cost of goo Gross prof Selling and Operating Interest exp Other expe national businesses. Kimi Ford read all the analysts' reports that she could find about the June 2x meeting, but the reports gave her no clear guidance: a Lehman Brothers report rec. ommended a strong buy, while UBS Warburg and CSFB analysts expressed misgiv. ings about the company and recommended a hold. Ford decided instead to develon her own discounted cash flow forecast to come to a clearer conclusion. Her forecast showed that, at a discount rate of 12%, Nike was overvalued at its current share price of $42.09 (Exhibit 2). However, she had done a quick sensitivity analysis that revealed Nike was undenalued at discount rates below 1 1.17%. Because she was about to go into a meeting, she asked her new assistant, Joanna Cohen, to Income be Income tax Net income Diluted ea estimate Nike's cost of capital. Cohen immediately gathered all the data she thought she might need (Exhibits 1 through 4) and began to work on her analysis. At the end of the day, Cohen submit- ted her cost-of-capital estimate and a memo (Exhibit 5) explaining her assumptions common Average sh outstand to Ford. Growth (% Revenue Operatingi Net income Margins ( Gross mar Operating Net margin Case 15 Nike, Inc.: Cost of Capital 237 EXHIBIT 1 Consolidated Income Statemen Yeer Ended May 31 n miltions of dollars except 1995 1996 1997 1998 1999 2000 2001 Cost of goods sold Gross profit $4,.760.8 $6.470.6 $9,186.5 $9553.1 $8,776.9 $8,995.1 $9,488.8 2.865.3 3906.7 5,503.0 6,065.5 5,4935 5,403.85,784.9 1,895.6 2,563.9 3,683.5 3,4876 3,283.4 3,591.3 3,703.9 Ores pindi dministrative 12098 1,5886 2,303.7 2,6238 24266 2606.4 2689 685.8 975.3 1,379.8 863.8 856.8 984.9 1,014.2 Operating income nterest expense Other expense, net Restructuring charge, net Income before income taxes 649.9 899.1 1,295.2 ncome taxes 24.2 39.5 11.736.7 32.3 20.9 21.5 232 52.3 60.0 45.0 58.7 2.5) 34.1 65.0 746.1 9192 921.4 129.9 2502 3459 4994 253.4 2947 3401 331.7 5 399.7 5 5532 795.8 399.6 4514 5 5791 $ 5997 Net income Oluted earnings per $1.36 $1.88 $268$1.35 $1.57 $207 $2.16 294.0 2936 2970 296.0 2875 279.a 273.3 common share Average shares outstanding (diluted Growth (%) 2.5 15.0 28.3 42.0 4.0 Operating income Net income 42.2 41.5 (37.4) 38.4 43.9(49.8) 13.0 5.5 3.0 1.8 (0.8) Margins (%) Gross margin 39.6 40.1 36.5 37.4 39.9 39.0 10.7 15.1 15.0 8.5 874.2 38.5 38.6 38.8 9.8 5.1 9.0 0.9 6.2 Bective tax rate (96). 36.0 statutory tax rate was 35%. The state tax varied yearly from 2.5% to 3.5%. data Company ing with the Securities and Exchange Commission (SEC), UBS Warburg Sources of Case 15 Nake, Inc.: Cost of Capital 239 EXHIBIT 3 I Consolidated Balance Sheets As of May 31, (in millions of dollars) Assets Current assets: 2000 2001 Cash and equivalents Accounts receivable Inventories Deferred income taxes Prepaid expenses s 254.3 1,569.4 1,446.0 304.0 ,621.4 ,424.1 113.3 162.5 215.2 3,596.4 Total current assets 3,625.3 Property, plant and equipment, net Identifiable intangible assets and goodwill, net 1,583.4 410.9 266.2 $5,856.9 1,618.8 397.3 178.2 Deferred income taxes and other assets Total assets $ 5,819.6 Liabilities and shareholders' equity Current liabilities: Current portion of long-term debt Notes payable Accounts payable Accrued liabilities Income taxes payable $ 50.1 924.2 543.8 621.9 $ 5.4 855.3 432.0 472.1 21,9 2,140.0 470.3 110.3 0.3 Total current liabilities 1,786.7 Long-term debt Deferred income taxes and other Siabilities Redeemable preferred stock Shareholders' equity: 435.9 102.2 0.3 2.8 369.0 Common stock, par Capital in excess of stated value Unearned stock compensation Accumulated other comprehensive income Retained earnings 2.8 459.4 (9.9) (152.1) 3,194.3 2,887.0 3.136.0 $ 5,856.9 3,494.5 $ 5,819.6 Total shareholders' equity Total liablities and shareholders equity Source of data Company fling with the Securities and Exchange Commission (SEC) EXHIBIT 4 I Capital-Market and Financial Information On or Around July 5, 2001 Current Yields on U.S. Treasuries 3.59% 3.50% 3.59% 488% 539% 5.74% Nke Share Price Performance Relative to S&P500 January 2000 to JAuly 5, 2001 1-year 5-year 10-year Historical Equity Risk Premiums (1926-1999) Geometric mean Arithmetic mean 590% 7.50% Current Yield on Publicly Traded Nike Debt 6.75% paid semi-annualy 07/15/96 07/15/21 Maturty Current Price $95.60 Nike Historic Betas 05 1996 1997 1998 1999 2000 YTD 6/30/01 0.98 0.84 0.84 0.63 0.83 0.69 Nike share price on July 5, 2001: s 42.09 Dividend History and Forecasts Payment Dates 31-Mar 31-Dec Total 0-Sep 0.10 0.12 0.12 0.12 30-Jun Average 0.80 1997 1998 1999 2000 0.10 0.12 0.12 0.12 0.12 0.10 0.12 0.12 0.12 0.12 0.10 0.12 0.12 0.12 0.40 0.48 0.48 0.48 Consensus EPS estimates: FY 2002 FY 2003 $2.67 $2.32 Value Line Forecast of Dividend Growth from 98-00 to Case IS Nike, Inc.: Cost of Capital 241 Kimi Ford Joanna Cohen July 6, 2001 Nike's cost of capital L Single or Multiple Costs of Capital? red was whether to use single or multiple costs of capital, given that Ni The irst question that multiple business segments. Aside from footwear, which makes 30% of revenue) that wear, skates, bats, and other equipment designed for sports activities ts revenue. Finally. Nke also sels some non-Nike-branded products such as Cole Haan dress and casual ochwear, and ice skates, skate blades, hookey sticks, hockey up 62% of its revenue, Nike also sells apparel In addition, Nike sells sport bals, ti t products account for 3.6% of jerseys, and other products under the Bauer l asked myself whether Nike's business segments had different enough risks from each other to warrant diferent costs of capital. Were their profies realy different? I conclkuded that it was only the Cole Haan line that t different; the rest were all Since Cole Haan makes up only a tiny fraction of revenues, however, I did not think that it was necessary to compute a separate ne apparel and footwear lines, they are sold through the same marketing and distribution oton marketed in other to compute only one cost of capital for the whole company cost of capital. As for of similar designs. Since I believe they face the same risk factors, I decided and are Il. Methodology y for Calculating the Cost of Capital: WACC Since Nke is tunded with both debt and equity, I used the WACC method (weighted-average cost of capital) Based on the latest available balance sheet debt as a proportion of total c accounts lor 73.0% Capital Sources capital makes up 27.0% and equity Book Values (in millions) Current portion of long-term debt Notes payable Long-term debt $ 5.4 855.3 435.9 $1,296.6 $3.494.5 27.0% of total capital 730% of total capital Cost of Debt My estimate of Nike's cost of debt is 4.3% l arri d at this es imate by taking total interest expense for the year 1 and dividing it by the company's average debt balance. The rate is lower than Treasury yields, but that is Nike raised a portion of its funding needs through Japanese yen notes, which carry rates between 2.0% and 4.3%. After adjusting for tax, the cost of debt comes out to 2.7%. used a tax rate ot 38%, which I obtained ading state taxes of 3% to the US statutory tax rate Historically, Nike's state taxes have ranged from 2.5% to 3.5% 242 Part Three Estimating the Cost of Capital EXHIBIT 5 I (continued IV. Cost of quiy cost of equity using the capital-asset-pricing model (CAPM). Other methods, such as the ratio, can be used to estimate the cost of oquity un and te I estimated the of In my opinion, however, the CAPM is the superior method risk-free rate, and the compound average premium of the wsed the et ovet My estrate of Nikes cost of equity is 10.5%) used the current yield on 20-year Treasury bonds an market over Treasury bonds (5.9%) as my nt mium. For beta, I took the average of Nike's betas from 1996 to the present Putting it All Together Inputting all my assumptions into the WACC formula, my esinate of Nike's cost of capital is 8.4%. 27.0% + 10.5% 73.0% 2.7% 84% 236 Part Three Estimating the Cost of Capital indistry veecan Mindy Grosman- ad pertomed etremely well On the eiEXHIBIT 1 Year Endec Nike would exert more effort on expense control. Finally, company executi ated their long-term revenue-growth targets of 8% to 10% and earnings of above 15%. ves reiter in millions Analysts' reactions were mixed. Some thought the financial t argets were ton aggressive: others saw significant growth opportunities in apparel and in Nike's inter Revenues Cost of goo Gross prof Selling and Operating Interest exp Other expe national businesses. Kimi Ford read all the analysts' reports that she could find about the June 2x meeting, but the reports gave her no clear guidance: a Lehman Brothers report rec. ommended a strong buy, while UBS Warburg and CSFB analysts expressed misgiv. ings about the company and recommended a hold. Ford decided instead to develon her own discounted cash flow forecast to come to a clearer conclusion. Her forecast showed that, at a discount rate of 12%, Nike was overvalued at its current share price of $42.09 (Exhibit 2). However, she had done a quick sensitivity analysis that revealed Nike was undenalued at discount rates below 1 1.17%. Because she was about to go into a meeting, she asked her new assistant, Joanna Cohen, to Income be Income tax Net income Diluted ea estimate Nike's cost of capital. Cohen immediately gathered all the data she thought she might need (Exhibits 1 through 4) and began to work on her analysis. At the end of the day, Cohen submit- ted her cost-of-capital estimate and a memo (Exhibit 5) explaining her assumptions common Average sh outstand to Ford. Growth (% Revenue Operatingi Net income Margins ( Gross mar Operating Net margin Case 15 Nike, Inc.: Cost of Capital 237 EXHIBIT 1 Consolidated Income Statemen Yeer Ended May 31 n miltions of dollars except 1995 1996 1997 1998 1999 2000 2001 Cost of goods sold Gross profit $4,.760.8 $6.470.6 $9,186.5 $9553.1 $8,776.9 $8,995.1 $9,488.8 2.865.3 3906.7 5,503.0 6,065.5 5,4935 5,403.85,784.9 1,895.6 2,563.9 3,683.5 3,4876 3,283.4 3,591.3 3,703.9 Ores pindi dministrative 12098 1,5886 2,303.7 2,6238 24266 2606.4 2689 685.8 975.3 1,379.8 863.8 856.8 984.9 1,014.2 Operating income nterest expense Other expense, net Restructuring charge, net Income before income taxes 649.9 899.1 1,295.2 ncome taxes 24.2 39.5 11.736.7 32.3 20.9 21.5 232 52.3 60.0 45.0 58.7 2.5) 34.1 65.0 746.1 9192 921.4 129.9 2502 3459 4994 253.4 2947 3401 331.7 5 399.7 5 5532 795.8 399.6 4514 5 5791 $ 5997 Net income Oluted earnings per $1.36 $1.88 $268$1.35 $1.57 $207 $2.16 294.0 2936 2970 296.0 2875 279.a 273.3 common share Average shares outstanding (diluted Growth (%) 2.5 15.0 28.3 42.0 4.0 Operating income Net income 42.2 41.5 (37.4) 38.4 43.9(49.8) 13.0 5.5 3.0 1.8 (0.8) Margins (%) Gross margin 39.6 40.1 36.5 37.4 39.9 39.0 10.7 15.1 15.0 8.5 874.2 38.5 38.6 38.8 9.8 5.1 9.0 0.9 6.2 Bective tax rate (96). 36.0 statutory tax rate was 35%. The state tax varied yearly from 2.5% to 3.5%. data Company ing with the Securities and Exchange Commission (SEC), UBS Warburg Sources of Case 15 Nake, Inc.: Cost of Capital 239 EXHIBIT 3 I Consolidated Balance Sheets As of May 31, (in millions of dollars) Assets Current assets: 2000 2001 Cash and equivalents Accounts receivable Inventories Deferred income taxes Prepaid expenses s 254.3 1,569.4 1,446.0 304.0 ,621.4 ,424.1 113.3 162.5 215.2 3,596.4 Total current assets 3,625.3 Property, plant and equipment, net Identifiable intangible assets and goodwill, net 1,583.4 410.9 266.2 $5,856.9 1,618.8 397.3 178.2 Deferred income taxes and other assets Total assets $ 5,819.6 Liabilities and shareholders' equity Current liabilities: Current portion of long-term debt Notes payable Accounts payable Accrued liabilities Income taxes payable $ 50.1 924.2 543.8 621.9 $ 5.4 855.3 432.0 472.1 21,9 2,140.0 470.3 110.3 0.3 Total current liabilities 1,786.7 Long-term debt Deferred income taxes and other Siabilities Redeemable preferred stock Shareholders' equity: 435.9 102.2 0.3 2.8 369.0 Common stock, par Capital in excess of stated value Unearned stock compensation Accumulated other comprehensive income Retained earnings 2.8 459.4 (9.9) (152.1) 3,194.3 2,887.0 3.136.0 $ 5,856.9 3,494.5 $ 5,819.6 Total shareholders' equity Total liablities and shareholders equity Source of data Company fling with the Securities and Exchange Commission (SEC) EXHIBIT 4 I Capital-Market and Financial Information On or Around July 5, 2001 Current Yields on U.S. Treasuries 3.59% 3.50% 3.59% 488% 539% 5.74% Nke Share Price Performance Relative to S&P500 January 2000 to JAuly 5, 2001 1-year 5-year 10-year Historical Equity Risk Premiums (1926-1999) Geometric mean Arithmetic mean 590% 7.50% Current Yield on Publicly Traded Nike Debt 6.75% paid semi-annualy 07/15/96 07/15/21 Maturty Current Price $95.60 Nike Historic Betas 05 1996 1997 1998 1999 2000 YTD 6/30/01 0.98 0.84 0.84 0.63 0.83 0.69 Nike share price on July 5, 2001: s 42.09 Dividend History and Forecasts Payment Dates 31-Mar 31-Dec Total 0-Sep 0.10 0.12 0.12 0.12 30-Jun Average 0.80 1997 1998 1999 2000 0.10 0.12 0.12 0.12 0.12 0.10 0.12 0.12 0.12 0.12 0.10 0.12 0.12 0.12 0.40 0.48 0.48 0.48 Consensus EPS estimates: FY 2002 FY 2003 $2.67 $2.32 Value Line Forecast of Dividend Growth from 98-00 to Case IS Nike, Inc.: Cost of Capital 241 Kimi Ford Joanna Cohen July 6, 2001 Nike's cost of capital L Single or Multiple Costs of Capital? red was whether to use single or multiple costs of capital, given that Ni The irst question that multiple business segments. Aside from footwear, which makes 30% of revenue) that wear, skates, bats, and other equipment designed for sports activities ts revenue. Finally. Nke also sels some non-Nike-branded products such as Cole Haan dress and casual ochwear, and ice skates, skate blades, hookey sticks, hockey up 62% of its revenue, Nike also sells apparel In addition, Nike sells sport bals, ti t products account for 3.6% of jerseys, and other products under the Bauer l asked myself whether Nike's business segments had different enough risks from each other to warrant diferent costs of capital. Were their profies realy different? I conclkuded that it was only the Cole Haan line that t different; the rest were all Since Cole Haan makes up only a tiny fraction of revenues, however, I did not think that it was necessary to compute a separate ne apparel and footwear lines, they are sold through the same marketing and distribution oton marketed in other to compute only one cost of capital for the whole company cost of capital. As for of similar designs. Since I believe they face the same risk factors, I decided and are Il. Methodology y for Calculating the Cost of Capital: WACC Since Nke is tunded with both debt and equity, I used the WACC method (weighted-average cost of capital) Based on the latest available balance sheet debt as a proportion of total c accounts lor 73.0% Capital Sources capital makes up 27.0% and equity Book Values (in millions) Current portion of long-term debt Notes payable Long-term debt $ 5.4 855.3 435.9 $1,296.6 $3.494.5 27.0% of total capital 730% of total capital Cost of Debt My estimate of Nike's cost of debt is 4.3% l arri d at this es imate by taking total interest expense for the year 1 and dividing it by the company's average debt balance. The rate is lower than Treasury yields, but that is Nike raised a portion of its funding needs through Japanese yen notes, which carry rates between 2.0% and 4.3%. After adjusting for tax, the cost of debt comes out to 2.7%. used a tax rate ot 38%, which I obtained ading state taxes of 3% to the US statutory tax rate Historically, Nike's state taxes have ranged from 2.5% to 3.5% 242 Part Three Estimating the Cost of Capital EXHIBIT 5 I (continued IV. Cost of quiy cost of equity using the capital-asset-pricing model (CAPM). Other methods, such as the ratio, can be used to estimate the cost of oquity un and te I estimated the of In my opinion, however, the CAPM is the superior method risk-free rate, and the compound average premium of the wsed the et ovet My estrate of Nikes cost of equity is 10.5%) used the current yield on 20-year Treasury bonds an market over Treasury bonds (5.9%) as my nt mium. For beta, I took the average of Nike's betas from 1996 to the present Putting it All Together Inputting all my assumptions into the WACC formula, my esinate of Nike's cost of capital is 8.4%. 27.0% + 10.5% 73.0% 2.7% 84%Step by Step Solution
There are 3 Steps involved in it
Step: 1

Get Instant Access to Expert-Tailored Solutions
See step-by-step solutions with expert insights and AI powered tools for academic success
Step: 2

Step: 3
Ace Your Homework with AI
Get the answers you need in no time with our AI-driven, step-by-step assistance
Get Started
Accounting Ledger Book
Authors: Alpha Planners Publishing
1st Edition
B09VWKPJSG, 979-8432472564