Answered step by step
Verified Expert Solution
Link Copied!

Question

1 Approved Answer

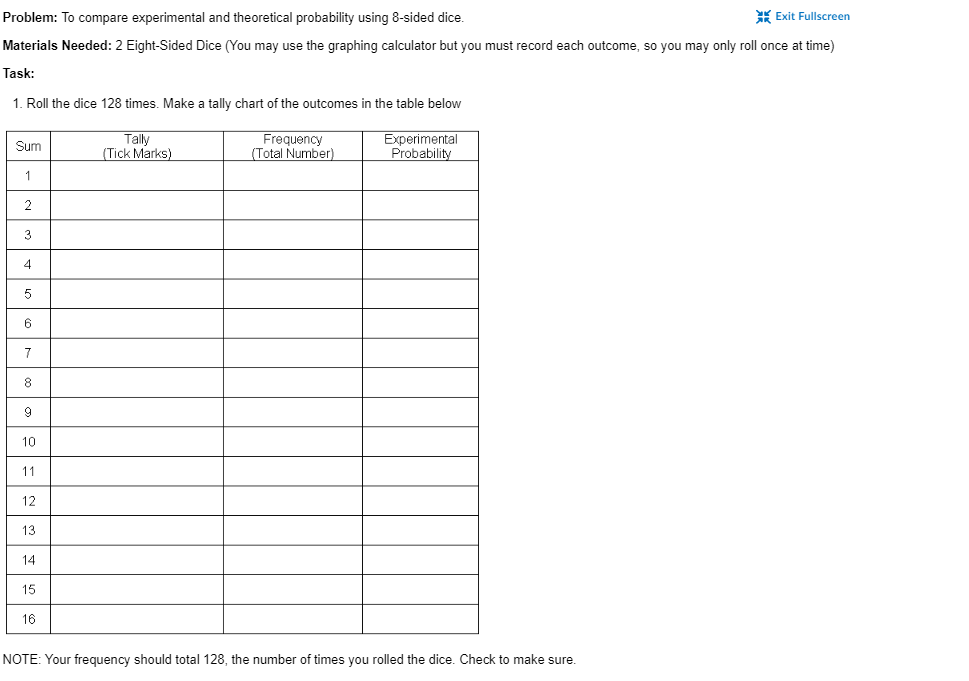
complete the following; Problem: To compare experimental and theoretical probability using 8-sided dice. Exit Fullscreen Materials Needed: 2 Eight-Sided Dice (You may use the graphing

complete the following;

image text in transcribedimage text in transcribed
Problem: To compare experimental and theoretical probability using 8-sided dice. Exit Fullscreen Materials Needed: 2 Eight-Sided Dice (You may use the graphing calculator but you must record each outcome, so you may only roll once at time) Task: 1. Roll the dice 128 times. Make a tally chart of the outcomes in the table below Sum Tally Frequency Experimental Tick Marks) Total Number) Probability 5 7 8 9 10 1 1 12 13 14 15 16 NOTE: Your frequency should total 128, the number of times you rolled the dice. Check to make sure.1. Use a distribution frequency to graph your results (Frequency vs. Sum). Answer the following questions: MK Exit Fullscreen a. Which number never came up? Why? b. Which number has occurred the most frequently? Why do you think that happened? c. Describe any trends in the graph. 2. Find the expected frequency if the die is rolled 104 times. To find the expected frequency, multiply the theoretical probability by 128 (the number of times the die would be tossed) Number Theoretical Probability Expected Frequency 2 3 4 6 00 10 11 12 13 14 15 16 1. Use a distribution frequency to graph your results (Expected Frequency vs. Sum). Answer the following questions: a. Which number would never came up? Why? b. Which number would you expect to occur the most frequently? c. Describe any trends in the graph. 2. Compare and contrast the experimental probability and the theoretical probability. a. Are there any probabilities the same? Any different? b. Would you expect them to be the same? C. How many rolled would be needed in order to have the theoretical and experimental probabilities close to being similar? 3. Compare the graphs. How are they similar? How are they different? 4. What conclusions can you draw from this experiment? 5. How would the probabilities change if two 12-sided die were used? What number would you expect to occur the most often? Explain. 6. What if a six-sided and a 12-sided die were used? Which number would you expect to come up the most often? Explain. Rubric

Step by Step Solution

There are 3 Steps involved in it

Step: 1

blur-text-image

Get Instant Access to Expert-Tailored Solutions

See step-by-step solutions with expert insights and AI powered tools for academic success

Step: 2

blur-text-image

Step: 3

blur-text-image

Ace Your Homework with AI

Get the answers you need in no time with our AI-driven, step-by-step assistance

Get Started

Recommended Textbook for

Probability and Stochastic Processes A Friendly Introduction for Electrical and Computer Engineers

Authors: Roy D. Yates, David J. Goodman

3rd edition

1118324560, 978-1118324561

More Books

Students also viewed these Mathematics questions

Question

Can you name six skills that a contract manager should have? 1

Answered: 1 week ago