Answered step by step
Verified Expert Solution
Link Copied!

Question

1 Approved Answer

Complete the following questions as holiday homework. 1. The titration curve in the graph below shows the change in pH as a solution of 0.10
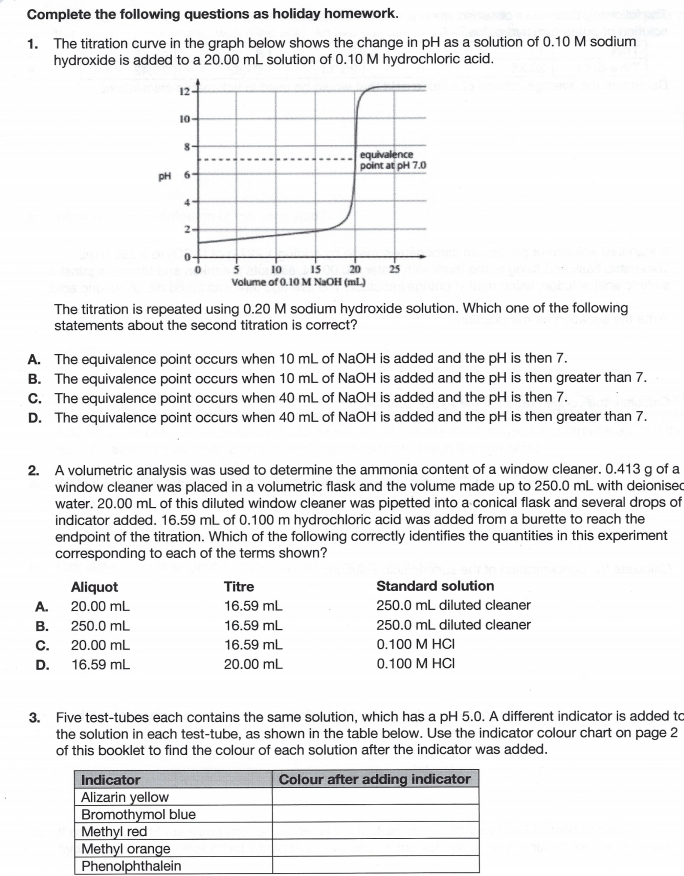
image text in transcribed

Complete the following questions as holiday homework. 1. The titration curve in the graph below shows the change in pH as a solution of 0.10 M sodium hydroxide is added to a 20.00 mL solution of 0.10 M hydrochloric acid. 124 10 8+ equivalence point at pH 7.0 pH 6- 4 2 20 Volume of 0.10 M NaOH (ml.) The titration is repeated using 0.20 M sodium hydroxide solution. Which one of the following statements about the second titration is correct? A. The equivalence point occurs when 10 mL of NaOH is added and the pH is then 7. B. The equivalence point occurs when 10 mL of NaOH is added and the pH is then greater than 7. C. The equivalence point occurs when 40 mL of NaOH is added and the pH is then 7. D. The equivalence point occurs when 40 mL of NaOH is added and the pH is then greater than 7. 2. A volumetric analysis was used to determine the ammonia content of a window cleaner. 0.413 g of a window cleaner was placed in a volumetric flask and the volume made up to 250.0 mL with deionised water. 20.00 mL of this diluted window cleaner was pipetted into a conical flask and several drops of indicator added. 16.59 mL of 0.100 m hydrochloric acid was added from a burette to reach the endpoint of the titration. Which of the following correctly identifies the quantities in this experiment corresponding to each of the terms shown? Aliquot Titre Standard solution A. 20.00 mL 16.59 mL 250.0 mL diluted cleaner B. 250.0 mL 16.59 mL 250.0 mL diluted cleaner c. 20.00 mL 16.59 mL 0.100 M HCI D. 16.59 mL 20.00 mL 0.100 M HCI 3. Five test-tubes each contains the same solution, which has a pH 5.0. A different indicator is added to the solution in each test-tube, as shown in the table below. Use the indicator colour chart on page 2 of this booklet to find the colour of each solution after the indicator was added. Indicator Colour after adding indicator Alizarin yellow Bromothymol blue Methyl red Methyl orange Phenolphthalein

Step by Step Solution

There are 3 Steps involved in it

Step: 1

blur-text-image

Get Instant Access to Expert-Tailored Solutions

See step-by-step solutions with expert insights and AI powered tools for academic success

Step: 2

blur-text-image_2

Step: 3

blur-text-image_3

Ace Your Homework with AI

Get the answers you need in no time with our AI-driven, step-by-step assistance

Get Started

Recommended Textbook for

Undergraduate Instrumental Analysis

Authors: James W Robinson, Eileen M Skelly Frame, George M Frame, George M Frame II

6th Edition

0824753593, 9780824753597

More Books

Students also viewed these Chemistry questions