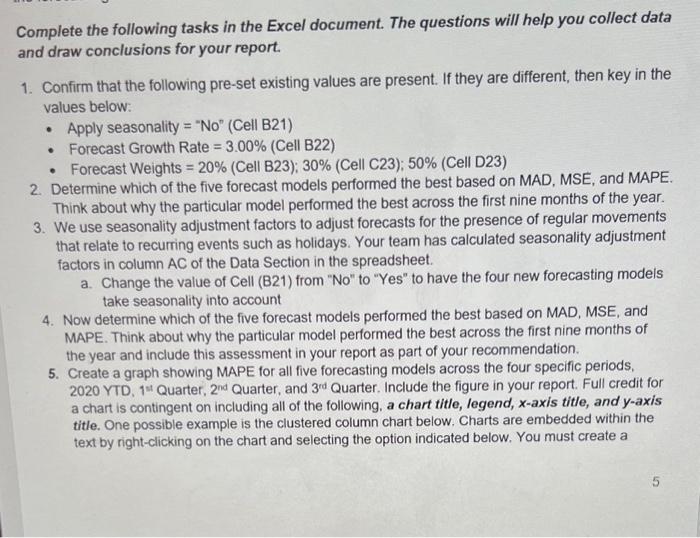
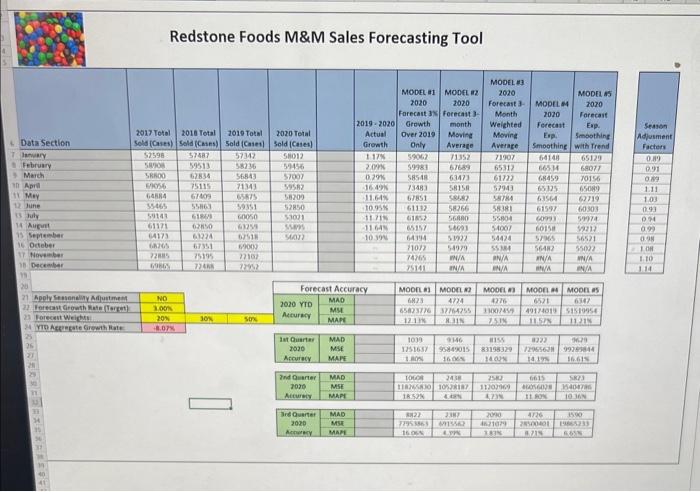
Complete the following tasks in the Excel document. The questions will help you collect data and draw conclusions for your report. 1. Confirm that the following pre-set existing values are present. If they are different, then key in the values below: - Apply seasonality = "No" (Cell B21) - Forecast Growth Rate =3.00% (Cell B22) - Forecast Weights = 20\% (Cell B23); 30% (Cell C23); 50% (Cell D23) 2. Determine which of the five forecast models performed the best based on MAD, MSE, and MAPE. Think about why the particular model performed the best across the first nine months of the year. 3. We use seasonality adjustment factors to adjust forecasts for the presence of regular movements that relate to recurring events such as holidays. Your team has calculated seasonality adjustment factors in column AC of the Data Section in the spreadsheet. a. Change the value of Cell (B21) from "No" to "Yes" to have the four new forecasting models take seasonality into account 4. Now determine which of the five forecast models performed the best based on MAD, MSE, and MAPE. Think about why the particular model performed the best across the first nine months of the year and include this assessment in your report as part of your recommendation. 5. Create a graph showing MAPE for all five forecasting models across the four specific periods, 2020 YTD, 1"I Quarter, 2nd Quarter, and 3td Quarter. Include the figure in your report. Full credit for a chart is contingent on including all of the following, a chart title, legend, x-axis title, and y-axis title. One possible example is the clustered column chart below. Charts are embedded within the text by right-clicking on the chart and selecting the option indicated below. You must create a 5 Redstone Foods M\&M Sales Forecasting Tool Complete the following tasks in the Excel document. The questions will help you collect data and draw conclusions for your report. 1. Confirm that the following pre-set existing values are present. If they are different, then key in the values below: - Apply seasonality = "No" (Cell B21) - Forecast Growth Rate =3.00% (Cell B22) - Forecast Weights = 20\% (Cell B23); 30% (Cell C23); 50% (Cell D23) 2. Determine which of the five forecast models performed the best based on MAD, MSE, and MAPE. Think about why the particular model performed the best across the first nine months of the year. 3. We use seasonality adjustment factors to adjust forecasts for the presence of regular movements that relate to recurring events such as holidays. Your team has calculated seasonality adjustment factors in column AC of the Data Section in the spreadsheet. a. Change the value of Cell (B21) from "No" to "Yes" to have the four new forecasting models take seasonality into account 4. Now determine which of the five forecast models performed the best based on MAD, MSE, and MAPE. Think about why the particular model performed the best across the first nine months of the year and include this assessment in your report as part of your recommendation. 5. Create a graph showing MAPE for all five forecasting models across the four specific periods, 2020 YTD, 1"I Quarter, 2nd Quarter, and 3td Quarter. Include the figure in your report. Full credit for a chart is contingent on including all of the following, a chart title, legend, x-axis title, and y-axis title. One possible example is the clustered column chart below. Charts are embedded within the text by right-clicking on the chart and selecting the option indicated below. You must create a 5 Redstone Foods M\&M Sales Forecasting Tool