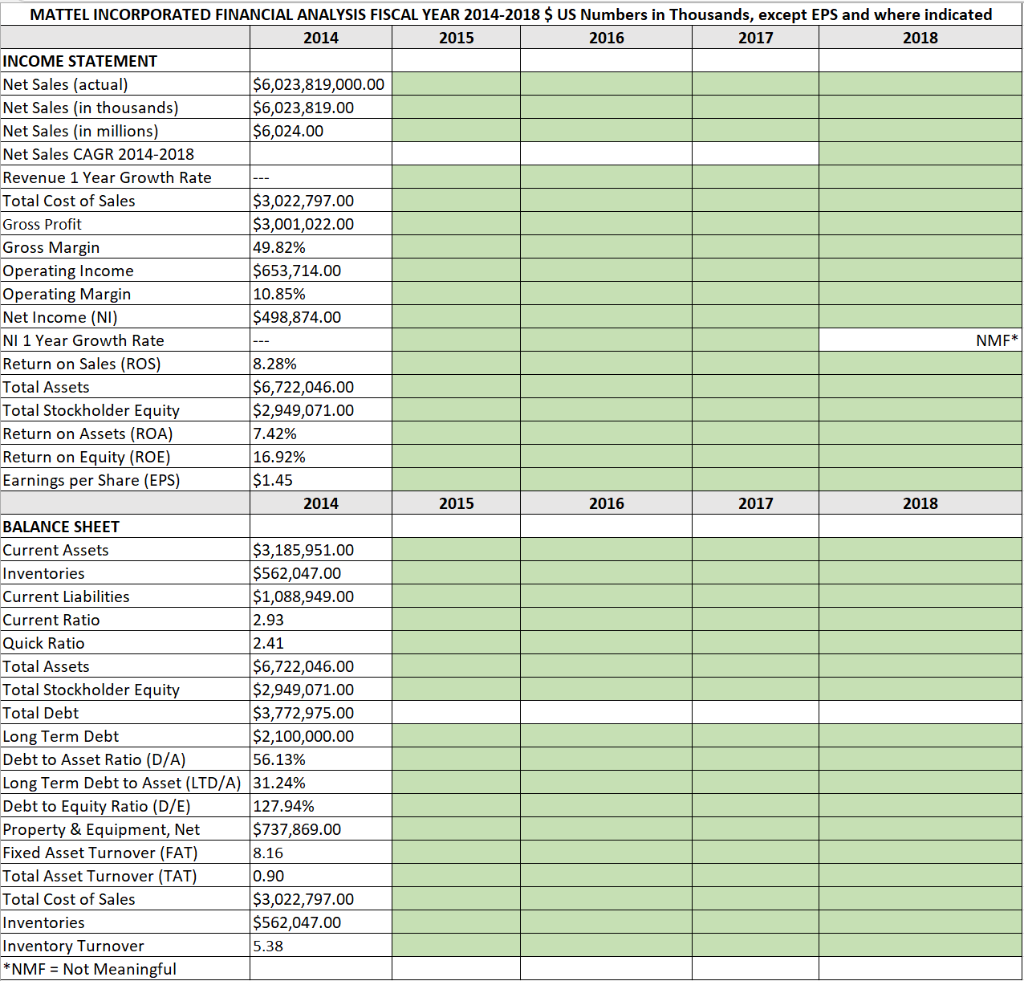
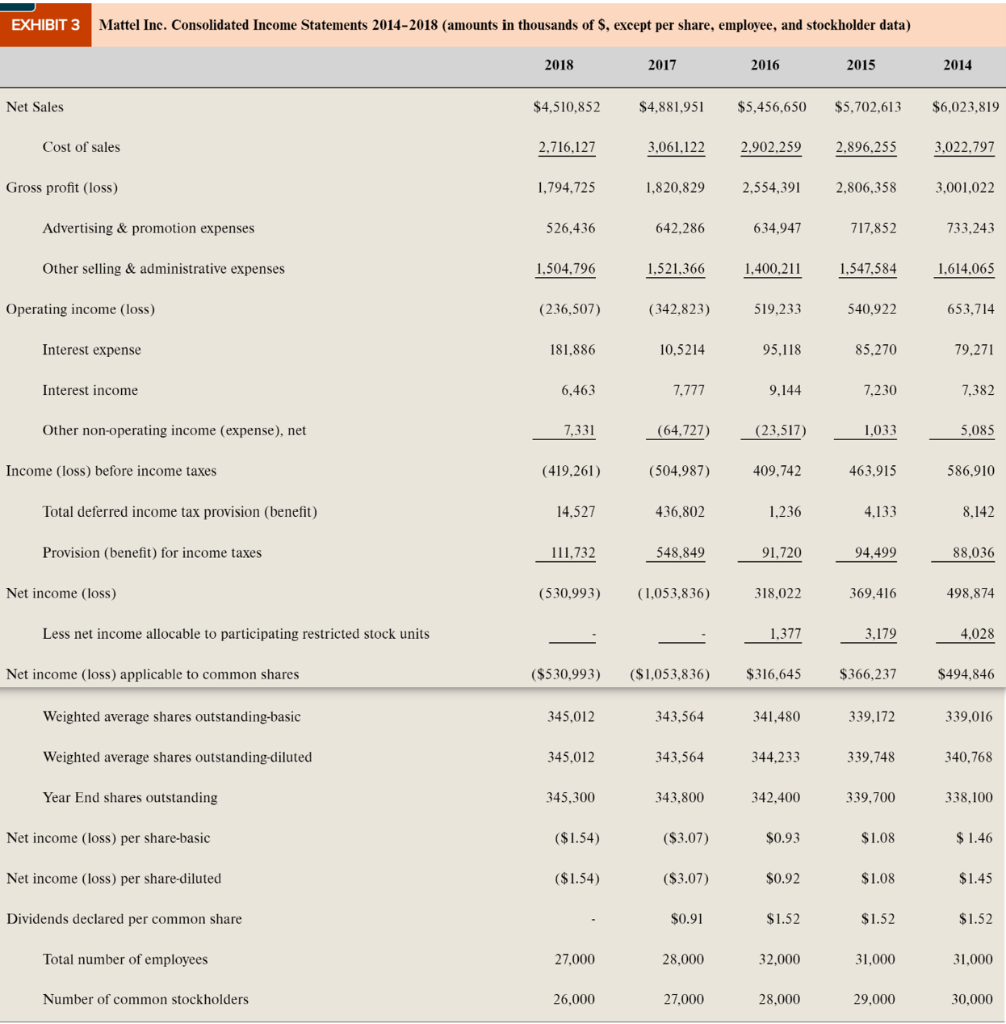
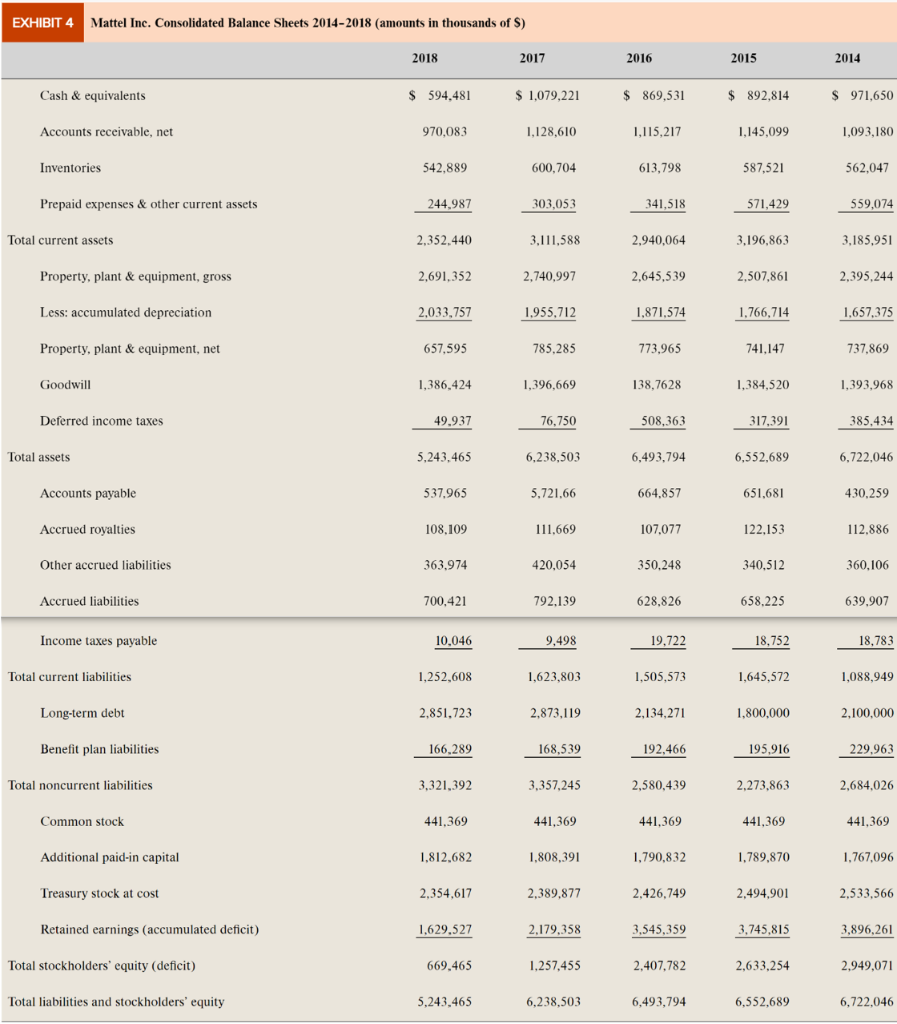
Complete the Mattel Incorporated Financial Analysis Assignment (Excel Spreadsheet) with your calculations of the indicated (green highlighted cells) financial ratios. Calculate your financial ratios for the spreadsheet from Exhibits 3 and 4 from the case. TIP: Use n=4 in your CAGR calculation.


MATTEL INCORPORATED FINANCIAL ANALYSIS FISCAL YEAR 2014-2018 $ US Numbers in Thousands, except EPS and where indicated 2014 2015 2016 2017 2018 INCOME STATEMENT Net Sales (actual) $6,023,819,000.00 Net Sales (in thousands) $6,023,819.00 $6,024.00 Net Sales (in millions) Net Sales CAGR 2014-2018 Revenue 1 Year Growth Rate --- Total Cost of Sales $3,022,797.00 Gross Profit $3,001,022.00 Gross Margin 49.82% Operating Income $653,714.00 Operating Margin 10.85% Net Income (NI) $498,874.00 NI 1 Year Growth Rate 8.28% Return on Sales (ROS) Total Assets $6,722,046.00 Total Stockholder Equity $2,949,071.00 Return on Assets (ROA) 7.42% Return on Equity (ROE) 16.92% Earnings per Share (EPS) $1.45 2014 2016 2017 BALANCE SHEET Current Assets $3,185,951.00 Inventories $562,047.00 Current Liabilities $1,088,949.00 Current Ratio 2.93 Quick Ratio 2.41 Total Assets $6,722,046.00 Total Stockholder Equity $2,949,071.00 Total Debt $3,772,975.00 Long Term Debt $2,100,000.00 Debt to Asset Ratio (D/A) 56.13% Long Term Debt to Asset (LTD/A) 31.24% 127.94% Debt to Equity Ratio (D/E) Property & Equipment, Net $737,869.00 Fixed Asset Turnover (FAT) 8.16 0.90 Total Asset Turnover (TAT) Total Cost of Sales $3,022,797.00 $562,047.00 Inventories Inventory Turnover 5.38 *NMF = Not Meaningful 2015 2018 NMF* EXHIBIT 3 Mattel Inc. Consolidated Income Statements 2014-2018 (amounts in thousands of $, except per share, employee, and stockholder data) 2018 2017 2016 2015 2014 Net Sales $4,510,852 $4,881,951 $5,456,650 $5,702,613 $6,023,819 Cost of sales 2,716,127 3,061,122 2,902,259 2,896,255 3,022.797 Gross profit (loss) 1,794,725 1,820,829 2,554,391 2,806,358 3,001,022 Advertising & promotion expenses 526,436 642,286 634,947 717,852 733,243 Other selling & administrative expenses 1,504,796 1,521,366 1,400,211 1,547,584 1,614,065 Operating income (loss) (236,507) (342,823) 519,233 540,922 653,714 Interest expense 181,886 10,5214 95,118 85,270 79,271 Interest income 6,463 7,777 9,144 7,230 7,382 Other non-operating income (expense), net 7,331 (64,727) (23,517) 1,033 5,085 (419,261) (504,987) 409,742 463,915 586,910 Total deferred income tax provision (benefit) 14,527 436,802 1,236 4.133 8,142 Provision (benefit) for income taxes 111,732 548,849 91,720 94,499 88,036 Net income (loss) (530,993) (1,053,836) 318,022 369,416 498,874 Less net income allocable to participating restricted stock units 1.377 3,179 4.028 Net income (loss) applicable to common shares ($530,993) ($1,053,836) $316,645 $366,237 $494,846 Weighted average shares outstanding-basic 345,012 343,564 341,480 339,172 339,016 Weighted average shares outstanding-diluted 345,012 343,564 344,233 339,748 340,768 Year End shares outstanding 345,300 343,800 342,400 339,700 338,100 Net income (loss) per share-basic ($3.07) $0.93 $1.08 $ 1.46 Net income (loss) per share-diluted ($3.07) $0.92 $1.08 $1.45 Dividends declared per common share $0.91 $1.52 $1.52 $1.52 Total number of employees 28,000 32,000 31,000 Number of common stockholders 27,000 28,000 30,000 Income (loss) before income taxes ($1.54) ($1.54) 27,000 26,000 31,000 29,000 EXHIBIT 4 Mattel Inc. Consolidated Balance Sheets 2014-2018 (amounts in thousands of S) 2018 2017 Cash & equivalents $ 594,481 $ 1,079,221 Accounts receivable, net 970,083 1,128,610 Inventories 542,889 600,704 Prepaid expenses & other current assets 244,987 303,053 2,352,440 3,111,588 Property, plant & equipment, gross 2,691,352 Less: accumulated depreciation 2,033,757 Property, plant & equipment, net 657.595 Goodwill 1,386,424 Deferred income taxes 49,937 5,243,465 Accounts payable 537,965 Accrued royalties 108,109 Other accrued liabilities 363,974 Accrued liabilities 700,421 Income taxes payable 10,046 1,252,608 2,851,723 166,289 3,321,392 441,369 1,812,682 2,354,617 1,629,527 669,465 5,243,465 Total current assets Total assets Total current liabilities Long-term debt Benefit plan liabilities Total noncurrent liabilities Common stock Additional paid-in capital Treasury stock at cost Retained earnings (accumulated deficit) Total stockholders' equity (deficit) Total liabilities and stockholders' equity 2,740,997 1,955,712 785,285 1,396,669 76,750 6,238,503 5,721,66 111,669 420,054 792,139 9,498 1,623,803 2,873,119 168,539 3,357,245 441,369 1,808,391 2,389,877 2,179,358 1,257,455 6,238,503 2016 $ 869,531 1,115,217 613,798 341,518 2,940,064 2,645,539 1,871,574 773,965 138,7628 508,363 6,493,794 664,857 107,077 350,248 628,826 19,722 1,505,573 2,134,271 192,466 2,580,439 441,369 1,790,832 2,426,749 3,545,359 2,407,782 6,493,794 2015 $ 892,814 1,145,099 587,521 571,429 3,196,863 2,507,861 1,766,714 741,147 1,384,520 317,391 6,552,689 651,681 122,153 340,512 658,225 18,752 1,645,572 1,800,000 195,916 2.273,863 441,369 1,789,870 2,494,901 3,745,815 2,633,254 6,552,689 2014 $ 971,650 1,093,180 562,047 559,074 3,185,951 2,395,244 1,657,375 737,869 1,393,968 385.434 6,722,046 430,259 112,886 360,106 639,907 18,783 1,088,949 2,100,000 229.963 2,684,026 441,369 1,767,096 2,533,566 3,896,261 2,949,071 6,722,046


