Question
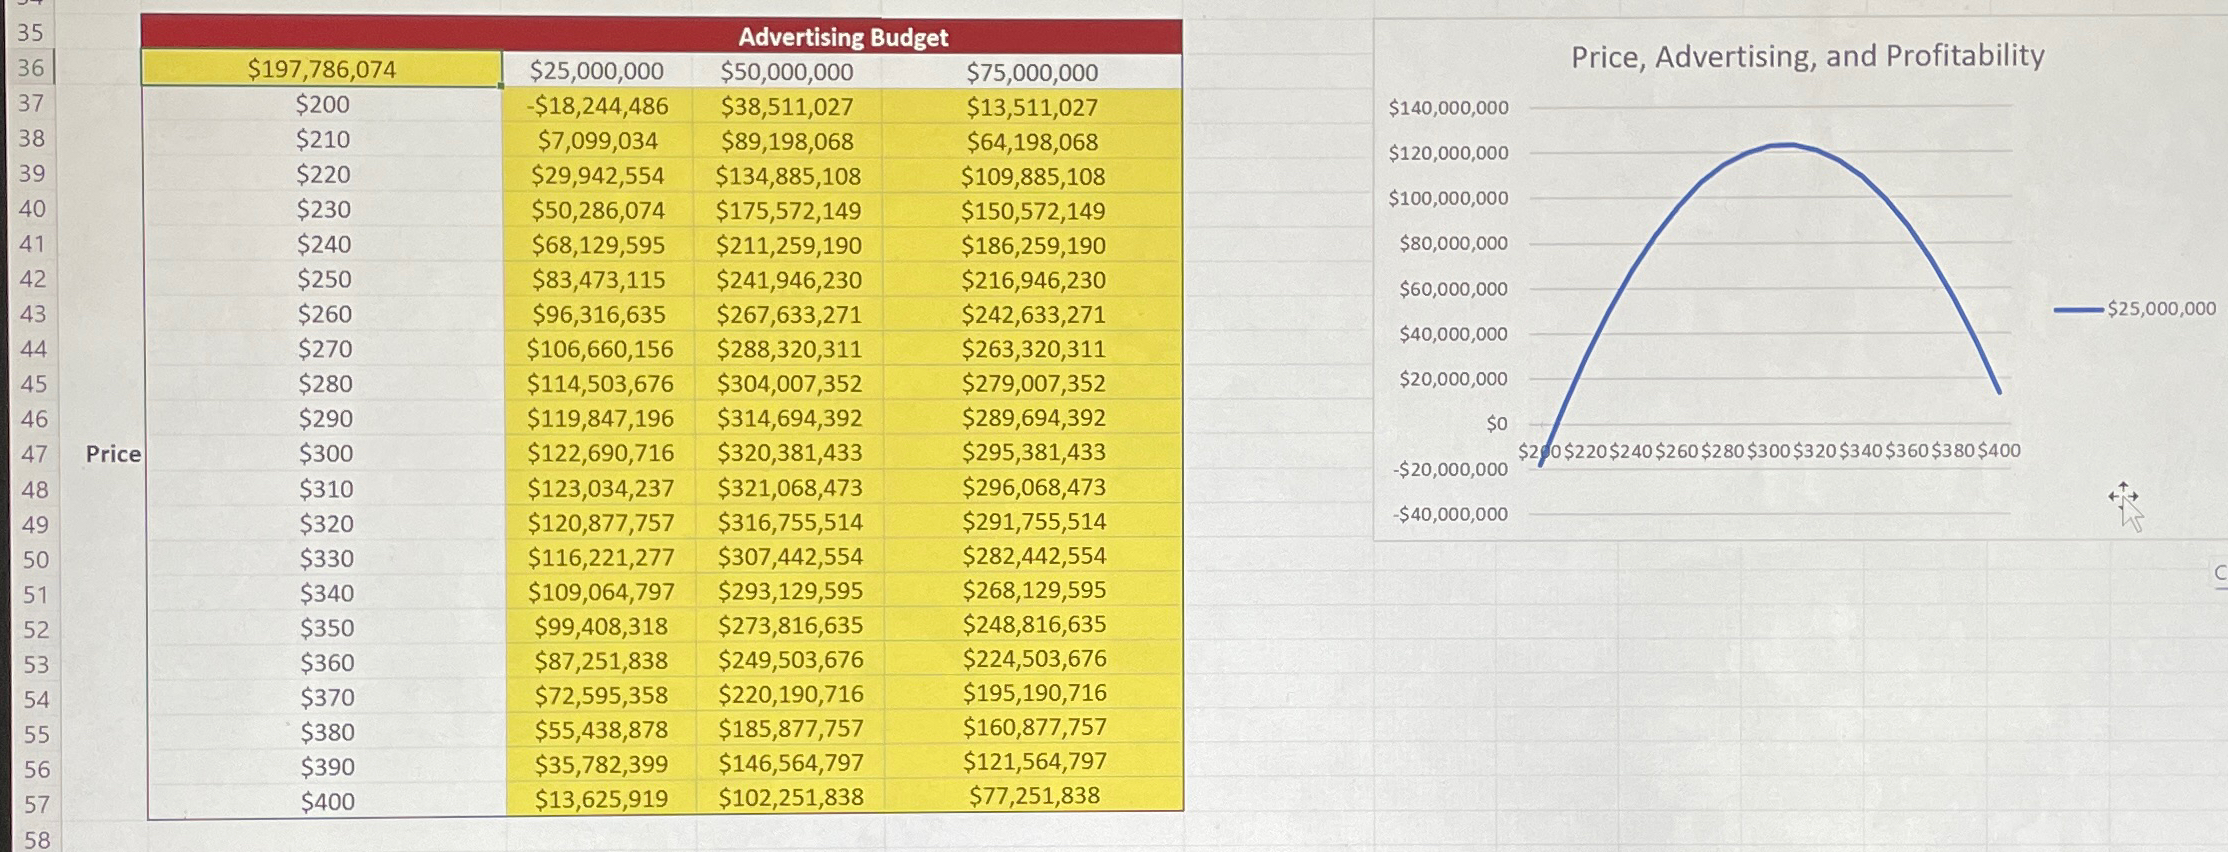
Complete the Price, Advertising, and Profitability chart. a . ?Notice that the series for $ 2 5 , 0 0 0 , 0 0 0
Complete the Price, Advertising, and Profitability chart.
a ?Notice that the series for $ ?is already on the chart.
b ?Add the series for advertising budgets $ ?and $ ?from your data table to the chart.
Consider the oneway data table. What is the optimal supplier contract?
$
$ ?Million
$ ?Million
$ ?Million
$ ?Million
$ ?Million
$ ?Million
$ ?Million
$ ?Million
$ ?Million
$ ?Million
?Consider the twoway data table. How much should ?the company spend on advertising to maximize profit?
$ ?Million
$ ?Million
$ ?Million
Consider the twoway data table. Where should the company set the price to maximize profit?
$
$
$
$
$
$
$
$
$
Price

33333 35 36 37 $197,786,074 $200 38 39 $210 $220 $7,099,034 $29,942,554 Advertising Budget $25,000,000 $50,000,000 -$18,244,486 $38,511,027 $89,198,068 $75,000,000 $13,511,027 $140,000,000 $64,198,068 $120,000,000 $134,885,108 $109,885,108 $100,000,000 40 $230 $50,286,074 $175,572,149 $150,572,149 41 $240 $68,129,595 $211,259,190 $186,259,190 $80,000,000 42 $250 $83,473,115 $241,946,230 $216,946,230 $60,000,000 43 $260 $96,316,635 $267,633,271 $242,633,271 $40,000,000 44 $270 $106,660,156 $288,320,311 $263,320,311 45 $280 46 $290 47 Price $300 $114,503,676 $304,007,352 $119,847,196 $122,690,716 $320,381,433 $279,007,352 $20,000,000 $314,694,392 $289,694,392 $295,381,433 -$20,000,000 48 $310 $123,034,237 $321,068,473 $296,068,473 49 $320 $120,877,757 $316,755,514 $291,755,514 -$40,000,000 50 $330 $116,221,277 $307,442,554 $282,442,554 51 $340 $109,064,797 $293,129,595 $268,129,595 52 $350 $99,408,318 $273,816,635 $248,816,635 53 $360 $87,251,838 $249,503,676 $224,503,676 54 $370 $72,595,358 $220,190,716 $195,190,716 55 $380 $55,438,878 $185,877,757 $160,877,757 56 $390 $35,782,399 $146,564,797 $121,564,797 57 $400 $13,625,919 $102,251,838 $77,251,838 58 Price, Advertising, and Profitability $0 $200 $220 $240 $260 $280 $300 $320 $340 $360 $380 $400 -$25,000,000 C
Step by Step Solution
There are 3 Steps involved in it
Step: 1

Get Instant Access to Expert-Tailored Solutions
See step-by-step solutions with expert insights and AI powered tools for academic success
Step: 2

Step: 3

Ace Your Homework with AI
Get the answers you need in no time with our AI-driven, step-by-step assistance
Get Started


