Answered step by step
Verified Expert Solution
Question
1 Approved Answer
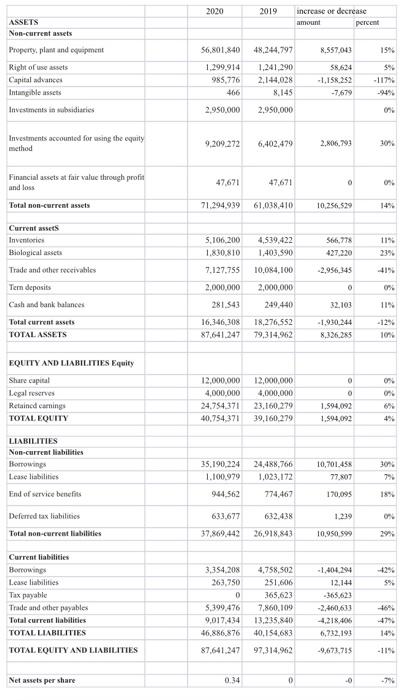
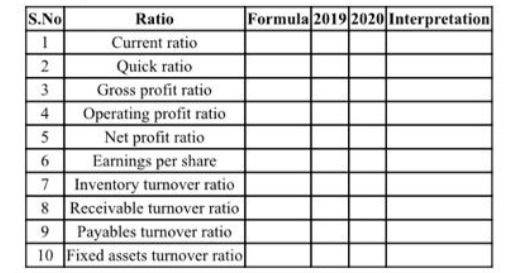
Complete the second schedule (Small table) 2020 2019 increase or decrease amount percent ASSETS Non-current assets Property, plant and equipment 56.801.840 8.557,043 15% Right of
Complete the second schedule (Small table) 

2020 2019 increase or decrease amount percent ASSETS Non-current assets Property, plant and equipment 56.801.840 8.557,043 15% Right of use assets Capital advances Intangible assets Investments in subsidiaries 1.299.914 985,776 466 48,244.797 1.241,290 2.144,028 8.145 58.624 1,158.252 -7,679 39 -117% 2.950.000 2,950,000 On Investments accounted for using the equity method 9,209272 6,402.479 2.806,793 30% 47,671 47,671 Financial assets at fair value through profit and loss Total non-current assets 71.294,939 61,038.410 10.256.529 11% 5.106.200 1.830.810 566,778 427.220 -2,956,345 41% Current assets Inventaries Biological assets Trade and other receivables Temn deposits Cash and bank balances Total current assets TOTAL ASSETS 4,539,422 1.403.590 10,084,100 2,000,000 249.440 18.276.552 79,314.962 0 7.127.755 2.000.000 281.543 16,346,308 87.641.247 0% 32.103 119 -1,930.244 8.326,285 107 EQUITY AND LIABILITIES Equity 0 OP Share capital Legal wives Retained earnings TOTAL EQUITY 12,000,000 4,000,000 24.754.371 40.754,371 12,000,000 4,000,000 23.160.279 39,160,279 0 1.594,092 1.594,092 6% 49 35.190.224 1.100.979 LIABILITIES Non-current liabilities Horrowings Lease liabilities End of service benefits Deferred tax liabilities Total non-current liabilities 24,488.766 1.023.172 774467 10,701,458 77.807 944,562 170,095 1.239 633,677 37.869.442 632.438 26,918.843 10,950.500 - 59 Current liabilities Borrowings Lease liabilities Tax payable Trade and other payables Total current liabilities TOTAL LIABILITIES TOTAL EQUITY AND LIABILITIES 3.354.208 263,750 0 5.399.476 9.017.434 46.&86.876 4,758,502 251,606 365.623 7.860,109 13.235.840 40,154,683 -1.404.294 12.144 -365.623 -2,460,633 -4,218406 6,732,193 -9,673.735 +6 87.641.247 97,314.962 -11% Net assets per share 0.34 0 . . S.No Ratio Formula 2019 2020 Interpretation 1 Current ratio 2 Quick ratio 3 Gross profit ratio 4 Operating profit ratio 5 Net profit ratio 6 Earnings per share 7 Inventory turnover ratio 8 Receivable turnover ratio 9 Payables turnover ratio 10 Fixed assets turnover ratio 

Step by Step Solution
There are 3 Steps involved in it
Step: 1

Get Instant Access to Expert-Tailored Solutions
See step-by-step solutions with expert insights and AI powered tools for academic success
Step: 2

Step: 3

Ace Your Homework with AI
Get the answers you need in no time with our AI-driven, step-by-step assistance
Get Started


