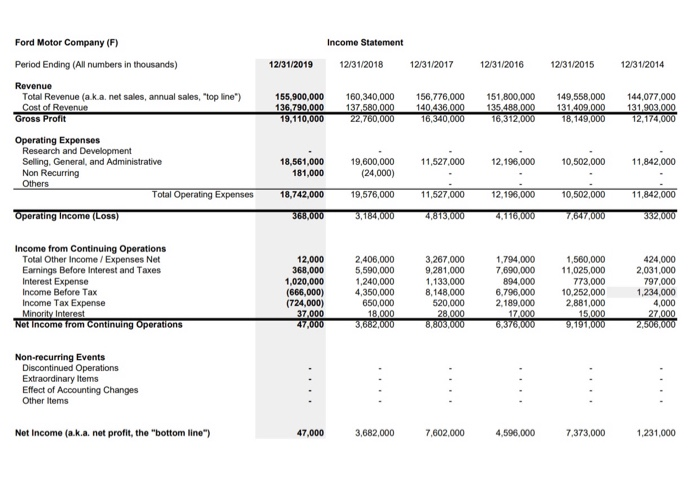
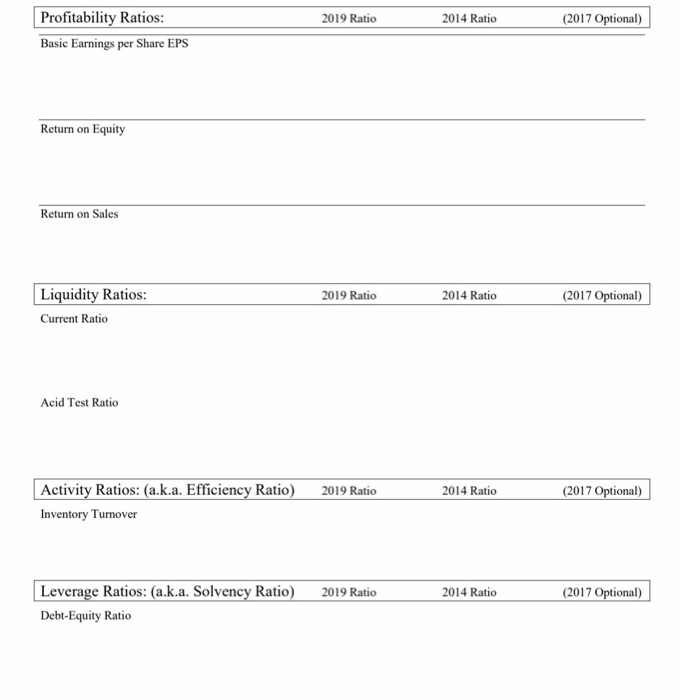
Complete the seven Financial Ratios as described for the years 2019, 2014. Please show the formula and all work
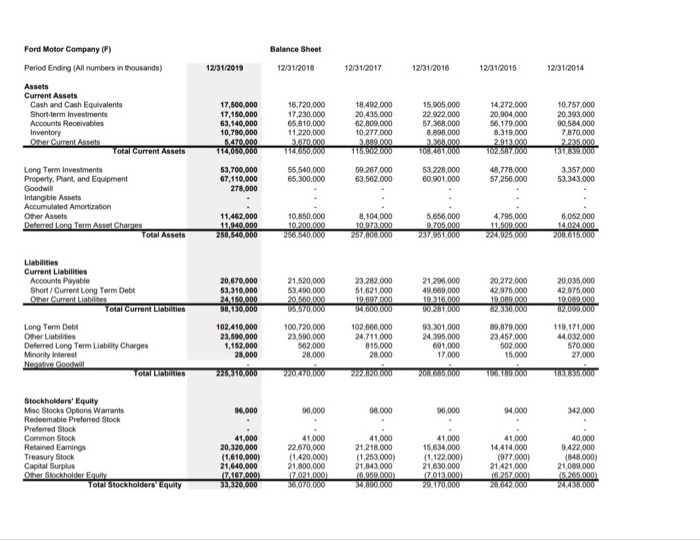
Balance Sheet 12/31/2019 12/31/2018 12/31/2017 12/31/2016 12/31/2015 12/31/2014 Ford Motor Company (F) Period Ending (All numbers in thousands) Assets Current Assets Cash and Cash Equivalents Short-term Investments Accounts Receivables Inventory Other Current Asset Total Current Assets Long Term Investments Property, Plant, and Equipment Goodwill Intangible Assets Accumulated Amortization Other Assets Deferred Long Term Asset Charges Total Assets 17,500,000 17,150,000 63,140,000 10,790,000 5470.000 114,6560,000 16.720,000 17,230,000 65,810,000 11.220,000 3.670.000 114660.000 56,540,000 65,300,000 18,492.000 20,435.000 62,809,000 10,277.000 3.889.000 115,902.000 15.905,000 22.922,000 57,368,000 8.898,000 3.368.000 108,461,000 14.272.000 20,904,000 56,179,000 8,319,000 2.913.000 102,587.000 10.757.000 20.393.000 90,584,000 7,870,000 2 285.000 131,69000 53,700,000 67,110,000 278,000 59,267 000 63,562.000 53.228,000 60.901,000 48,778,000 57.256,000 3.357.000 53,343,000 11,462,000 11,940,000 258,640,000 10,850,000 10.200.000 256,540,000 8,104.000 10.973.000 257,806600 5.656,000 9.705.000 23795,000 4,795,000 11.509.000 6,052,000 14.024.000 208,6157000 20.035,000 42.975,000 10.000.000 02.0997000 Liabilities Current Liabilities Accounts Payable Short/Current Long Term Debt Other Current Liabilities Total Current Liabilities Long Term Debt Other Liabilities Deferred Long Term Liabilty Charges Minority interest Nove Goswil 20,670,000 53,310,000 24.150.000 90,130,000 102,410,000 23,690,000 1,182,000 28,000 228,370,000 21,520,000 53.490,000 20.500.000 96,570,000 100,720,000 23,500,000 562,000 28,000 23,282.000 51,621,000 19.607.000 94.000.000 102,666.000 24,711,000 815.000 28.000 21.296,000 49.660,000 19.316.000 SO 281,000 19.301.000 24.395,000 691,000 17.000 20,272.000 42,975.000 19.089.000 82,336,000 80,879.000 23.457.000 502.000 15,000 119,171,000 44,032,000 570.000 27.000 2807270.00 T8000 96,000 96,000 98,000 96,000 94,000 342.000 Stockholders' Equity Misc Stocks Options Warrants Redeemable Preferred Stock Preferred Stock Common Stock Retained Earings Treasury Stock Capital Surplus Other Stockholder Equity Total Stockholders' quity 41,000 20,320,000 (1,610,000) 21,640,000 (7167000) 33,320,000 41,000 22.670,000 (1.420,000) 21.800,000 2021000) 36.070.000 41.000 21,218.000 (1.253.000) 21,843.000 16.959.000) 34,HOTO 41,000 15.634,000 (1.122,000) 21.630,000 2013.000 20.170.000 41,000 14 414,000 (977.000) 21 421,000 16 257000) 40,000 9.422,000 (848,000) 21,089,000 5.265.000) 245.000 Income Statement 12/31/2019 12/31/2018 12/31/2017 12/31/2016 12/31/2015 12/31/2014 Ford Motor Company (F) Period Ending (All numbers in thousands) Revenue Total Revenue (aka, net sales, annual sales, "top line") Gross Profit Cost of Revenue 155,900,000 136.790.000 19,110,000 160,340,000 137.580,000 22,760,000 156,776,000 140.436.000 16,340.000 151,800,000 135.489.000 16,312,000 149,558,000 131 409,000 18,149,000 144,077.000 131,903.000 12,174,000 11,527.000 18,561,000 181,000 12,196,000 10,502,000 11,842.000 Operating Expenses Research and Development Selling. General, and Administrative Non Recurring Others Total Operating Expenses Operating Income (Loss) 19,600,000 (24.000) 18,742,000 19,576,000 11,527,000 12,196,000 10,502,000 11,842,000 368,000 3,184,000 4,813,000 4,116,000 7,647,000 332.000 Income from Continuing Operations Total Other Income / Expenses Net Earnings Before Interest and Taxes Interest Expense Income Before Tax Income Tax Expense Minority Interest Not Income from Continuing Operations 12,000 368,000 1,020,000 (666,000) (724,000) 37.000 47,000 2,406,000 5,590,000 1,240,000 4,350,000 650,000 18.000 3,662,000 3,267,000 9,281,000 1,133,000 8,148,000 520,000 28.000 8.803,000 1,794,000 7,690,000 894,000 6.796,000 2,189,000 17,000 6.375.000 1,560,000 11,025,000 773,000 10,252,000 2,881,000 15,000 9,191,000 424,000 2,031,000 797.000 1,234,000 4,000 27.000 2,506,000 Non-recurring Events Discontinued Operations Extraordinary Items Effect of Accounting Changes Other Items Net Income (a.k.a. net profit, the "bottom line") 47,000 3,682,000 7,602,000 4,596,000 7,373,000 1,231,000 2019 Ratio 2014 Ratio (2017 Optional) Profitability Ratios: Basic Earnings per Share EPS Return on Equity Return on Sales 2019 Ratio 2014 Ratio (2017 Optional) Liquidity Ratios: Current Ratio Acid Test Ratio 2014 Ratio (2017 Optional) Activity Ratios: (a.k.a. Efficiency Ratio) 2019 Ratio Inventory Turnover 2019 Ratio 2014 Ratio (2017 Optional) Leverage Ratios: (a.k.a. Solvency Ratio) Debt-Equity Ratio