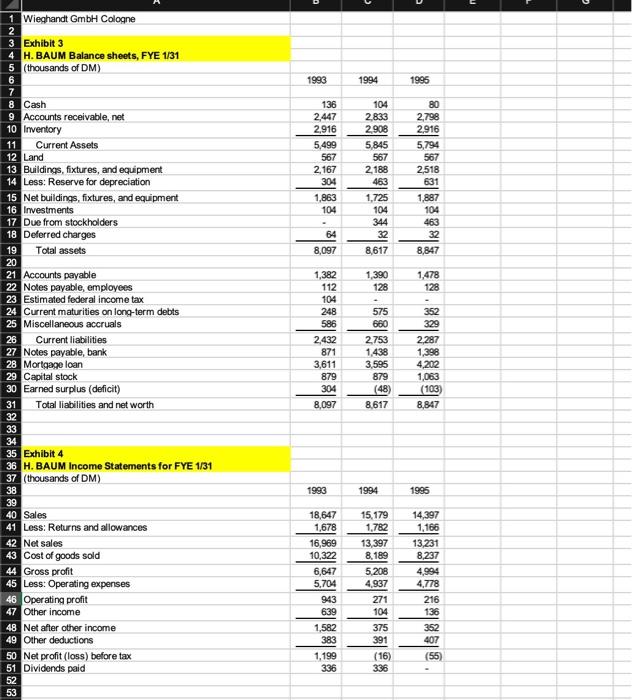
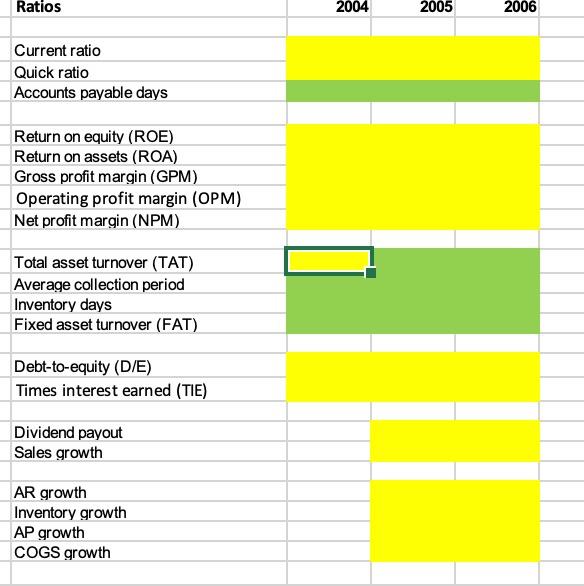
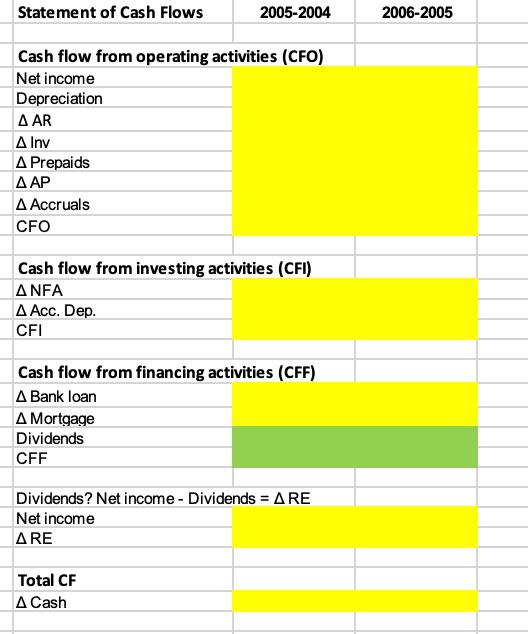
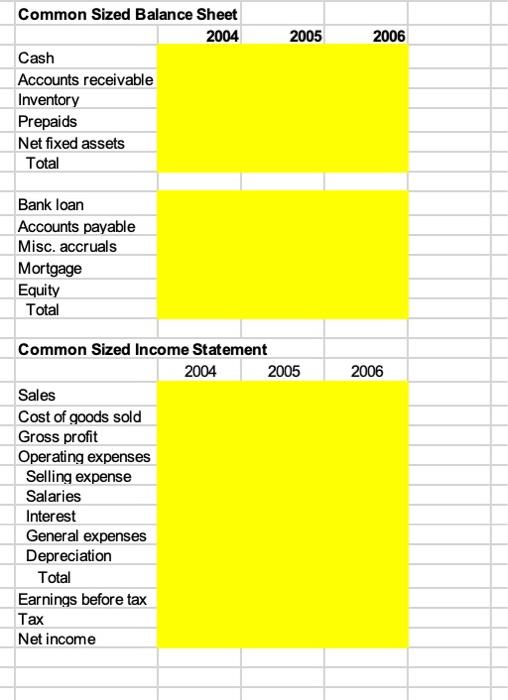
1 Wieghandt GmbH Cologne 3 Exhibit 3 4 H. BAUM Balance sheets, FYE 1/31 5 (thousands of DM) 6 7 \begin{tabular}{ll|l} 1993 & 1994 & 1996 \end{tabular} 8910CashAccountsreceivable,netImventory 11 Current Assets 12 Land 13 Buildings, fixtures, and equipment 14 Less: Reserve for depreciation 15 Net buildings, fixtures, and equipment 16 Investments 17 Due from stockholders 18 Deferred charges 19 Tolal assets \begin{tabular}{|r|r|r|} \hline 136 & 104 & 80 \\ \hline 2,447 & 2,833 & 2,798 \\ \hline 2,916 & 2,908 & 2,916 \\ \hline 5,499 & 5,845 & 5,794 \\ \hline 567 & 567 & 567 \\ \hline 2,167 & 2,188 & 2,518 \\ \hline 304 & 463 & 631 \\ \hline 1,863 & 1,725 & 1,887 \\ \hline 104 & 104 & 104 \\ \hline & 344 & 463 \\ \hline 64 & 32 & 32 \\ \hline 8,097 & 8,617 & 8,847 \\ \hline \end{tabular} 21 Accounts payable 22 Notes payable, employees 23 Estimated federal income tax 24 Current maturities on long-term debts 25 Miscellanecus accruals 26 Current liabilities 27 Notes payable, bank 28 Mortgage loan 29 Capital stock 30 Earned surplus (deficit) 31 Total liabilities and net worth 8,0973048,617(48)8,847(103) Exhibit 4 H. BAUM Income Statements for FYE 1/31 (thousands of DM) Ratios Current ratio Quick ratio Accounts payable days Return on equity (ROE) Return on assets (ROA) Gross profit margin (GPM) Operating profit margin (OPM) Net profit margin (NPM) Total asset turnover (TAT) Average collection period Inventory days Fixed asset turnover (FAT) Debt-to-equity (D/E) Times interest earned (TIE) Dividend payout Sales growth AR growth Inventory growth AP growth COGS growth Statement of Cash Flows 2005200420062005 Cash flow from operating activities (CFO) Net income Depreciation AR lnv Prepaids AP Accruals CFO Cash flow from investing activities (CFI) NFA Acc. Dep. CFI Cash flow from financing activities (CFF) Bank loan Mortgage Dividends CFF Dividends? Net income Dividends =RE Net income RE Total CF Cash Common Sized Balance Sheet 200420052006 Cash Accounts receivable Inventory Prepaids Net fixed assets Total Bank loan Accounts payable Misc. accruals Mortgage Equity Total Common Sized Income Statement Sales Cost of goods sold Gross profit Operating expenses Selling expense Salaries Interest General expenses Depreciation Total Earnings before tax Tax Net income 1 Wieghandt GmbH Cologne 3 Exhibit 3 4 H. BAUM Balance sheets, FYE 1/31 5 (thousands of DM) 6 7 \begin{tabular}{ll|l} 1993 & 1994 & 1996 \end{tabular} 8910CashAccountsreceivable,netImventory 11 Current Assets 12 Land 13 Buildings, fixtures, and equipment 14 Less: Reserve for depreciation 15 Net buildings, fixtures, and equipment 16 Investments 17 Due from stockholders 18 Deferred charges 19 Tolal assets \begin{tabular}{|r|r|r|} \hline 136 & 104 & 80 \\ \hline 2,447 & 2,833 & 2,798 \\ \hline 2,916 & 2,908 & 2,916 \\ \hline 5,499 & 5,845 & 5,794 \\ \hline 567 & 567 & 567 \\ \hline 2,167 & 2,188 & 2,518 \\ \hline 304 & 463 & 631 \\ \hline 1,863 & 1,725 & 1,887 \\ \hline 104 & 104 & 104 \\ \hline & 344 & 463 \\ \hline 64 & 32 & 32 \\ \hline 8,097 & 8,617 & 8,847 \\ \hline \end{tabular} 21 Accounts payable 22 Notes payable, employees 23 Estimated federal income tax 24 Current maturities on long-term debts 25 Miscellanecus accruals 26 Current liabilities 27 Notes payable, bank 28 Mortgage loan 29 Capital stock 30 Earned surplus (deficit) 31 Total liabilities and net worth 8,0973048,617(48)8,847(103) Exhibit 4 H. BAUM Income Statements for FYE 1/31 (thousands of DM) Ratios Current ratio Quick ratio Accounts payable days Return on equity (ROE) Return on assets (ROA) Gross profit margin (GPM) Operating profit margin (OPM) Net profit margin (NPM) Total asset turnover (TAT) Average collection period Inventory days Fixed asset turnover (FAT) Debt-to-equity (D/E) Times interest earned (TIE) Dividend payout Sales growth AR growth Inventory growth AP growth COGS growth Statement of Cash Flows 2005200420062005 Cash flow from operating activities (CFO) Net income Depreciation AR lnv Prepaids AP Accruals CFO Cash flow from investing activities (CFI) NFA Acc. Dep. CFI Cash flow from financing activities (CFF) Bank loan Mortgage Dividends CFF Dividends? Net income Dividends =RE Net income RE Total CF Cash Common Sized Balance Sheet 200420052006 Cash Accounts receivable Inventory Prepaids Net fixed assets Total Bank loan Accounts payable Misc. accruals Mortgage Equity Total Common Sized Income Statement Sales Cost of goods sold Gross profit Operating expenses Selling expense Salaries Interest General expenses Depreciation Total Earnings before tax Tax Net income


