Answered step by step
Verified Expert Solution
Question
1 Approved Answer
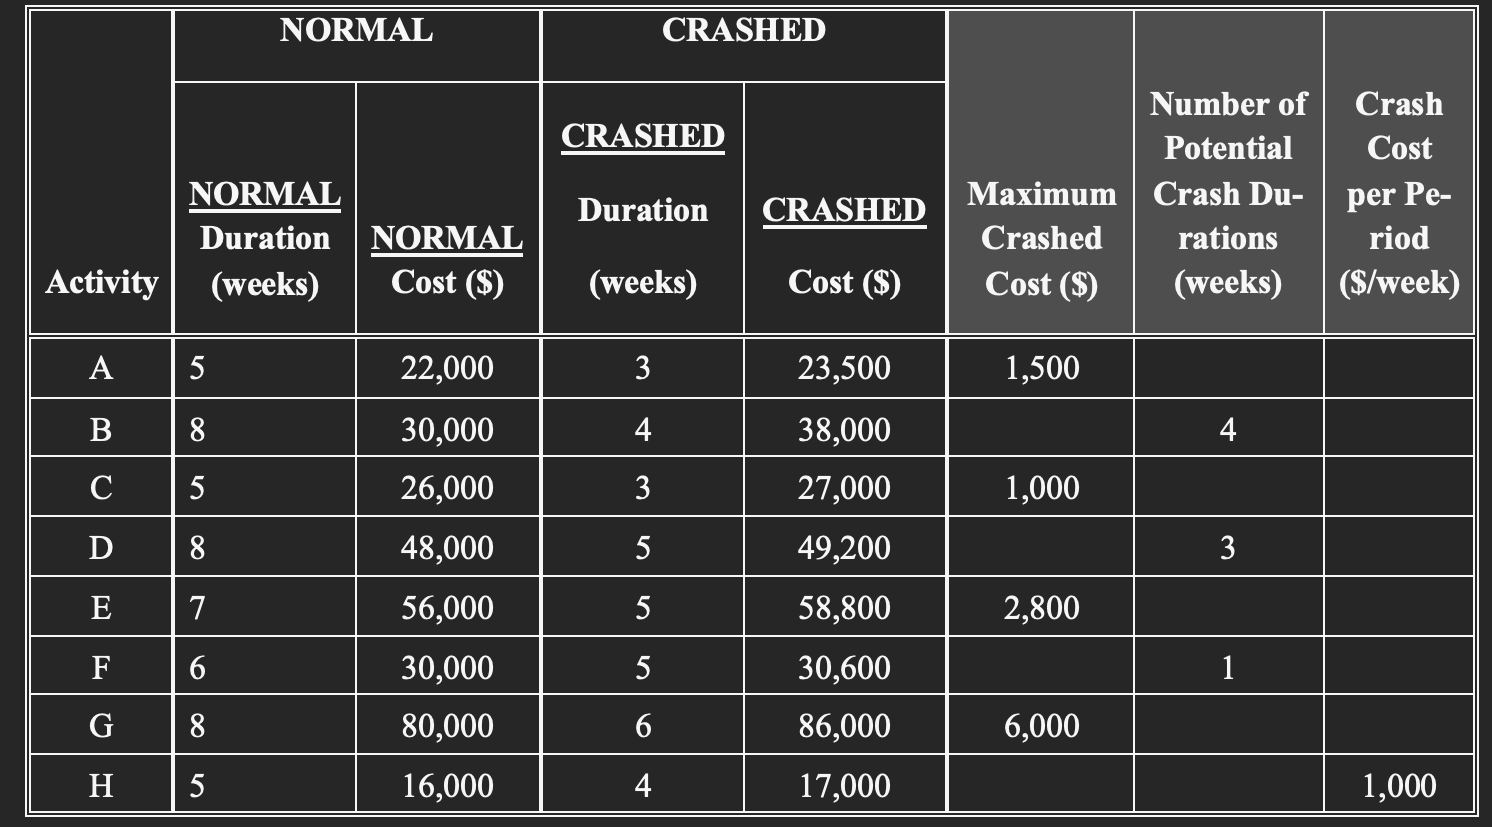
Complete the table above (i.e., Maximum Crashed Cost, Number of Potential Crash Durations, and Crash Cost per Period), and use the information to conduct project


Complete the table above (i.e., Maximum Crashed Cost, Number of Potential Crash Durations, and Crash Cost per Period), and use the information to conduct project crashing.
The following Project Network Paths have been identified:
Path 1: B D G H = 8 + 8 + 8 + 5 = 29 weeks
Path 2: A C E G H = 5 + 5 + 7 + 8 + 5 = 30 weeks
Path 3: A C F H = 5 + 5 + 6 + 5 = 21 weeks
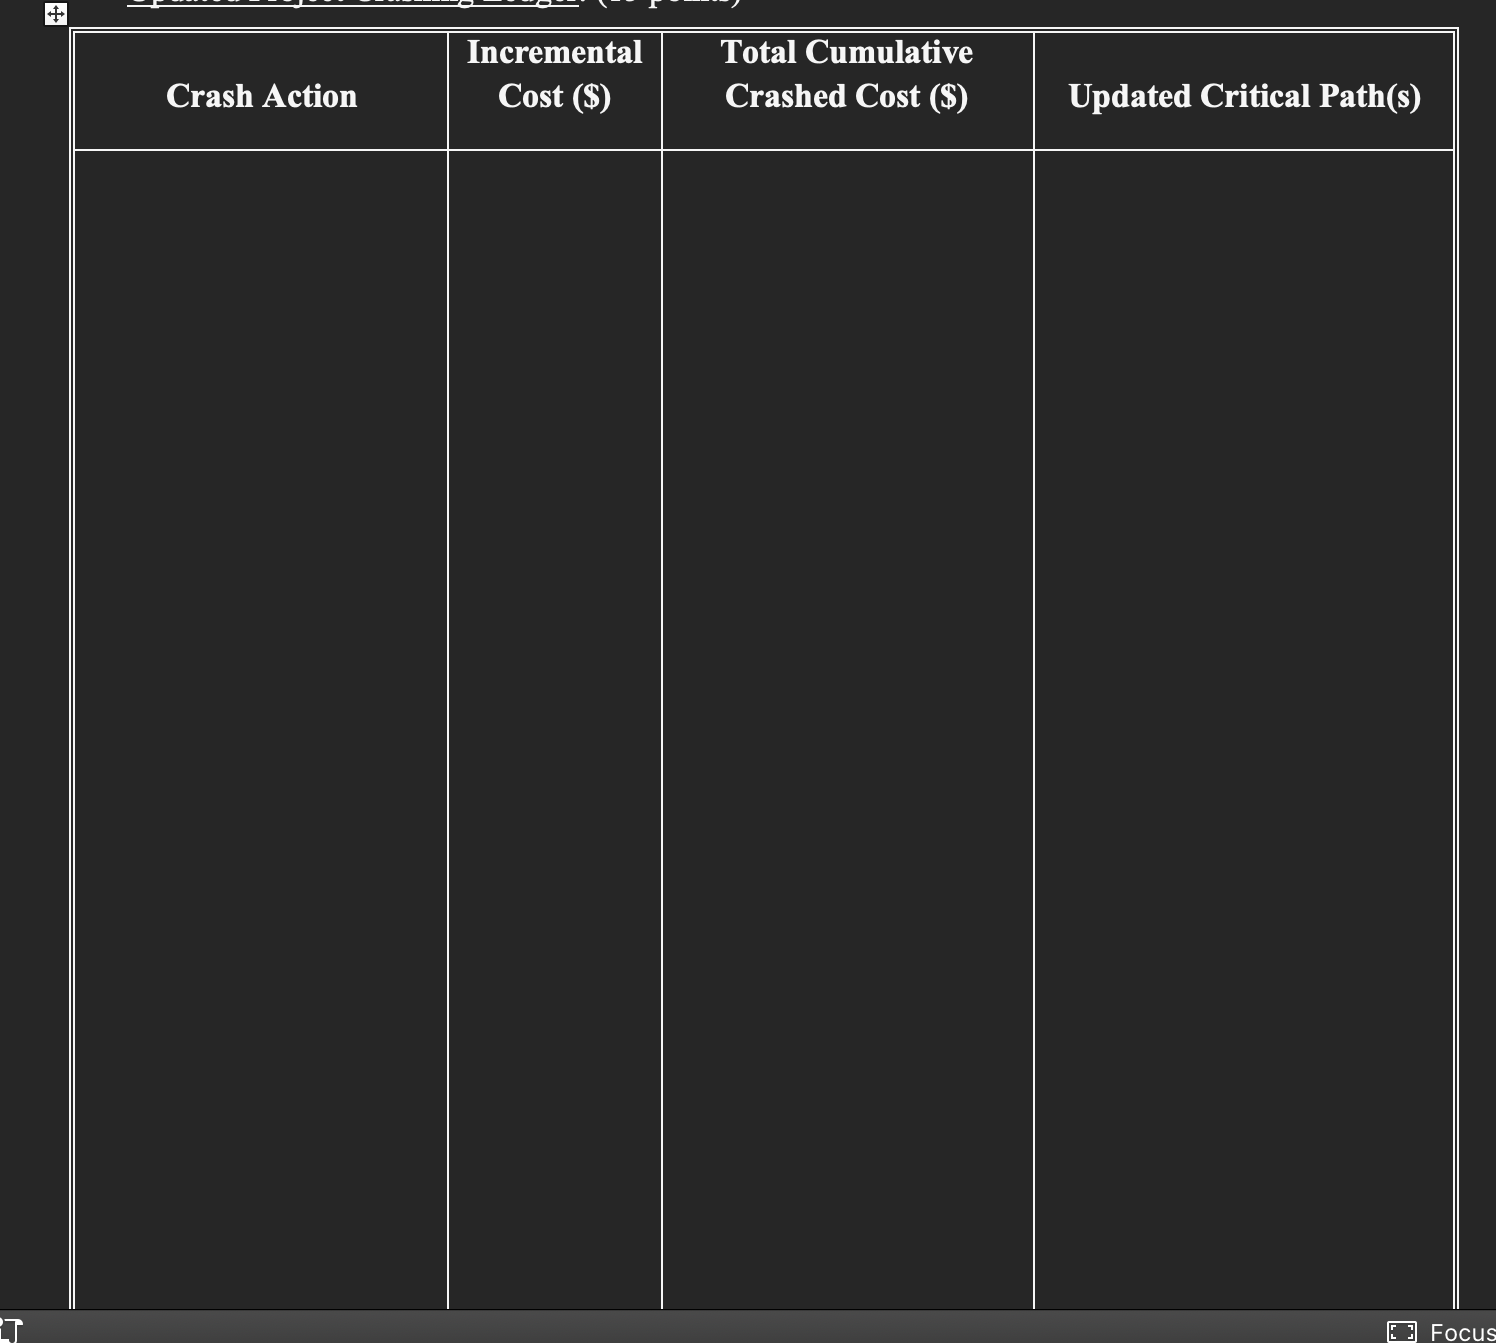
- Using the three project networks paths and the project crashing ledger show each step of the project crashing protocol to reduce the project from 30 to 26 weeks in the cheapest manner possible.
- Please show the details for each step. For example, if you need to analyze either selecting one common activity or multiple activities unique to each critical path, please show this analysis at each step.
- Documentation of each correct step (e.g., project crashing ledger, or a detailed process of your choosing).
- Choose the cheapest approach too
- After you have completed the project crashing, please identify the following:
- Final project network paths with updated activity and path times (after crashing); you may neatly show this part using the updated paths on the ledger paper.
- Final critical path(s)
\begin{tabular}{|c|c|c|c|c|c|c|c|} \hline \multirow[b]{2}{*}{ Activity } & \multicolumn{2}{|c|}{ NORMAL } & \multicolumn{2}{|c|}{ CRASHED } & \multirow[b]{2}{*}{MaximumCrashedCost($)} & \multirow[b]{2}{*}{NumberofPotentialCrashDu-rations(weeks)} & \multirow[b]{2}{*}{CrashCostperPe-riod($/week)} \\ \hline & & Cost($)NORMAL & CRASHEDDuration(weeks) & CRASHEDCost($) & & & \\ \hline & 5 & 22,000 & 3 & 23,500 & 1,500 & & \\ \hline B & 8 & 30,000 & 4 & 38,000 & & 4 & \\ \hline C & 5 & 26,000 & 3 & 27,000 & 1,000 & & \\ \hline D & 8 & 48,000 & 5 & 49,200 & & 3 & \\ \hline E & 7 & 56,000 & 5 & 58,800 & 2,800 & & \\ \hline F & 6 & 30,000 & 5 & 30,600 & & 1 & \\ \hline G & 8 & 80,000 & 6 & 86,000 & 6,000 & & \\ \hline H & 5 & 16,000 & 4 & 17,000 & & & 1,000 \\ \hline \end{tabular} \begin{tabular}{|l|l|l|l|} \hline Crash Action & IncrementalCost($) & TotalCumulativeCrashedCost($) & Updated Critical Path(s) \\ \hline & & & \\ & & & \\ & & & \end{tabular}
Step by Step Solution
There are 3 Steps involved in it
Step: 1

Get Instant Access to Expert-Tailored Solutions
See step-by-step solutions with expert insights and AI powered tools for academic success
Step: 2

Step: 3

Ace Your Homework with AI
Get the answers you need in no time with our AI-driven, step-by-step assistance
Get Started


