Answered step by step
Verified Expert Solution
Question
1 Approved Answer
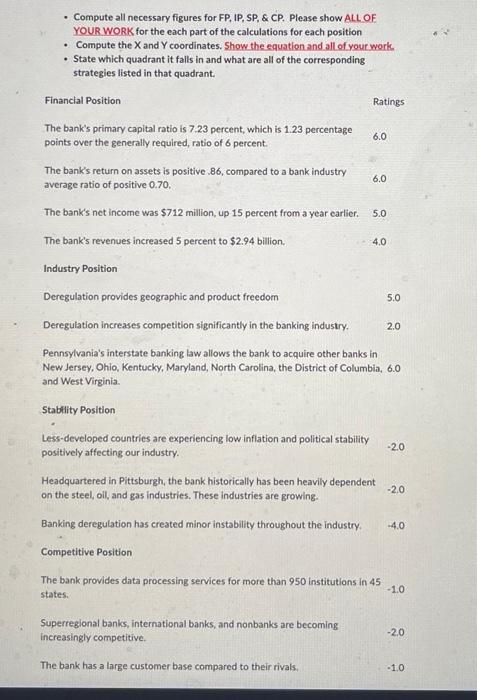
Compute all necessary figures for FP,IP,SP & CP. Please show all work of the caculations for each position. Compute the X and Y coordinates, Show
Compute all necessary figures for FP,IP,SP & CP. Please show all work of the caculations for each position.
- Compute all necessary figures for FP, IP, SP, \& CP. Please show ALLOE YOUR WORK for the each part of the calculations for each position - Compute the X and Y coordinates. Show the equation and all of your work. - State which quadrant it falls in and what are all of the corresponding strategies listed in that quadrant. Financial Position Ratings The bank's primary capital ratio is 7.23 percent, which is 1.23 percentage points over the generally required, ratio of 6 percent. 6.0 The bank's return on assets is positive .86, compared to a bank industry average ratio of positive 0.70 . 6.0 The bank's net incorne was $712 million, up 15 percent from a year earlier. 5.0 The bank's revenues increased 5 percent to $2.94 billion. 4.0 Industry Position Deregulation provides geographic and product freedom 5.0 Deregulation increases competition significantly in the banking industry. 2.0 Pennsylvania's interstate banking law allows the bank to acquire other banks in New Jersey, Ohio, Kentucky, Maryland, North Carolina, the District of Columbia, 6.0 and West Virginia. Stablity Position Less-developed countries are experiencing low inflation and political stability positively affecting our industry. 2.0 Headquartered in Pittsburgh, the bank historically has been heavily dependent on the steel, oil, and gas industries. These industries are growing. 2.0 Banking deregulation has created minor instability throughout the industry. 4.0 Competitive Position The bank provides data processing services for more than 950 institutions in 45 states. 1.0 Superregional banks, international banks, and nonbanks are becoming increasingly competitive. 2.0 The bank has a large customer base compared to their rivals: .10 - Compute all necessary figures for FP, IP, SP, \& CP. Please show ALLOE YOUR WORK for the each part of the calculations for each position - Compute the X and Y coordinates. Show the equation and all of your work. - State which quadrant it falls in and what are all of the corresponding strategies listed in that quadrant. Financial Position Ratings The bank's primary capital ratio is 7.23 percent, which is 1.23 percentage points over the generally required, ratio of 6 percent. 6.0 The bank's return on assets is positive .86, compared to a bank industry average ratio of positive 0.70 . 6.0 The bank's net incorne was $712 million, up 15 percent from a year earlier. 5.0 The bank's revenues increased 5 percent to $2.94 billion. 4.0 Industry Position Deregulation provides geographic and product freedom 5.0 Deregulation increases competition significantly in the banking industry. 2.0 Pennsylvania's interstate banking law allows the bank to acquire other banks in New Jersey, Ohio, Kentucky, Maryland, North Carolina, the District of Columbia, 6.0 and West Virginia. Stablity Position Less-developed countries are experiencing low inflation and political stability positively affecting our industry. 2.0 Headquartered in Pittsburgh, the bank historically has been heavily dependent on the steel, oil, and gas industries. These industries are growing. 2.0 Banking deregulation has created minor instability throughout the industry. 4.0 Competitive Position The bank provides data processing services for more than 950 institutions in 45 states. 1.0 Superregional banks, international banks, and nonbanks are becoming increasingly competitive. 2.0 The bank has a large customer base compared to their rivals: .10 Compute the X and Y coordinates, Show the equation
State which quadrant it falls in 

Step by Step Solution
There are 3 Steps involved in it
Step: 1

Get Instant Access to Expert-Tailored Solutions
See step-by-step solutions with expert insights and AI powered tools for academic success
Step: 2

Step: 3

Ace Your Homework with AI
Get the answers you need in no time with our AI-driven, step-by-step assistance
Get Started


