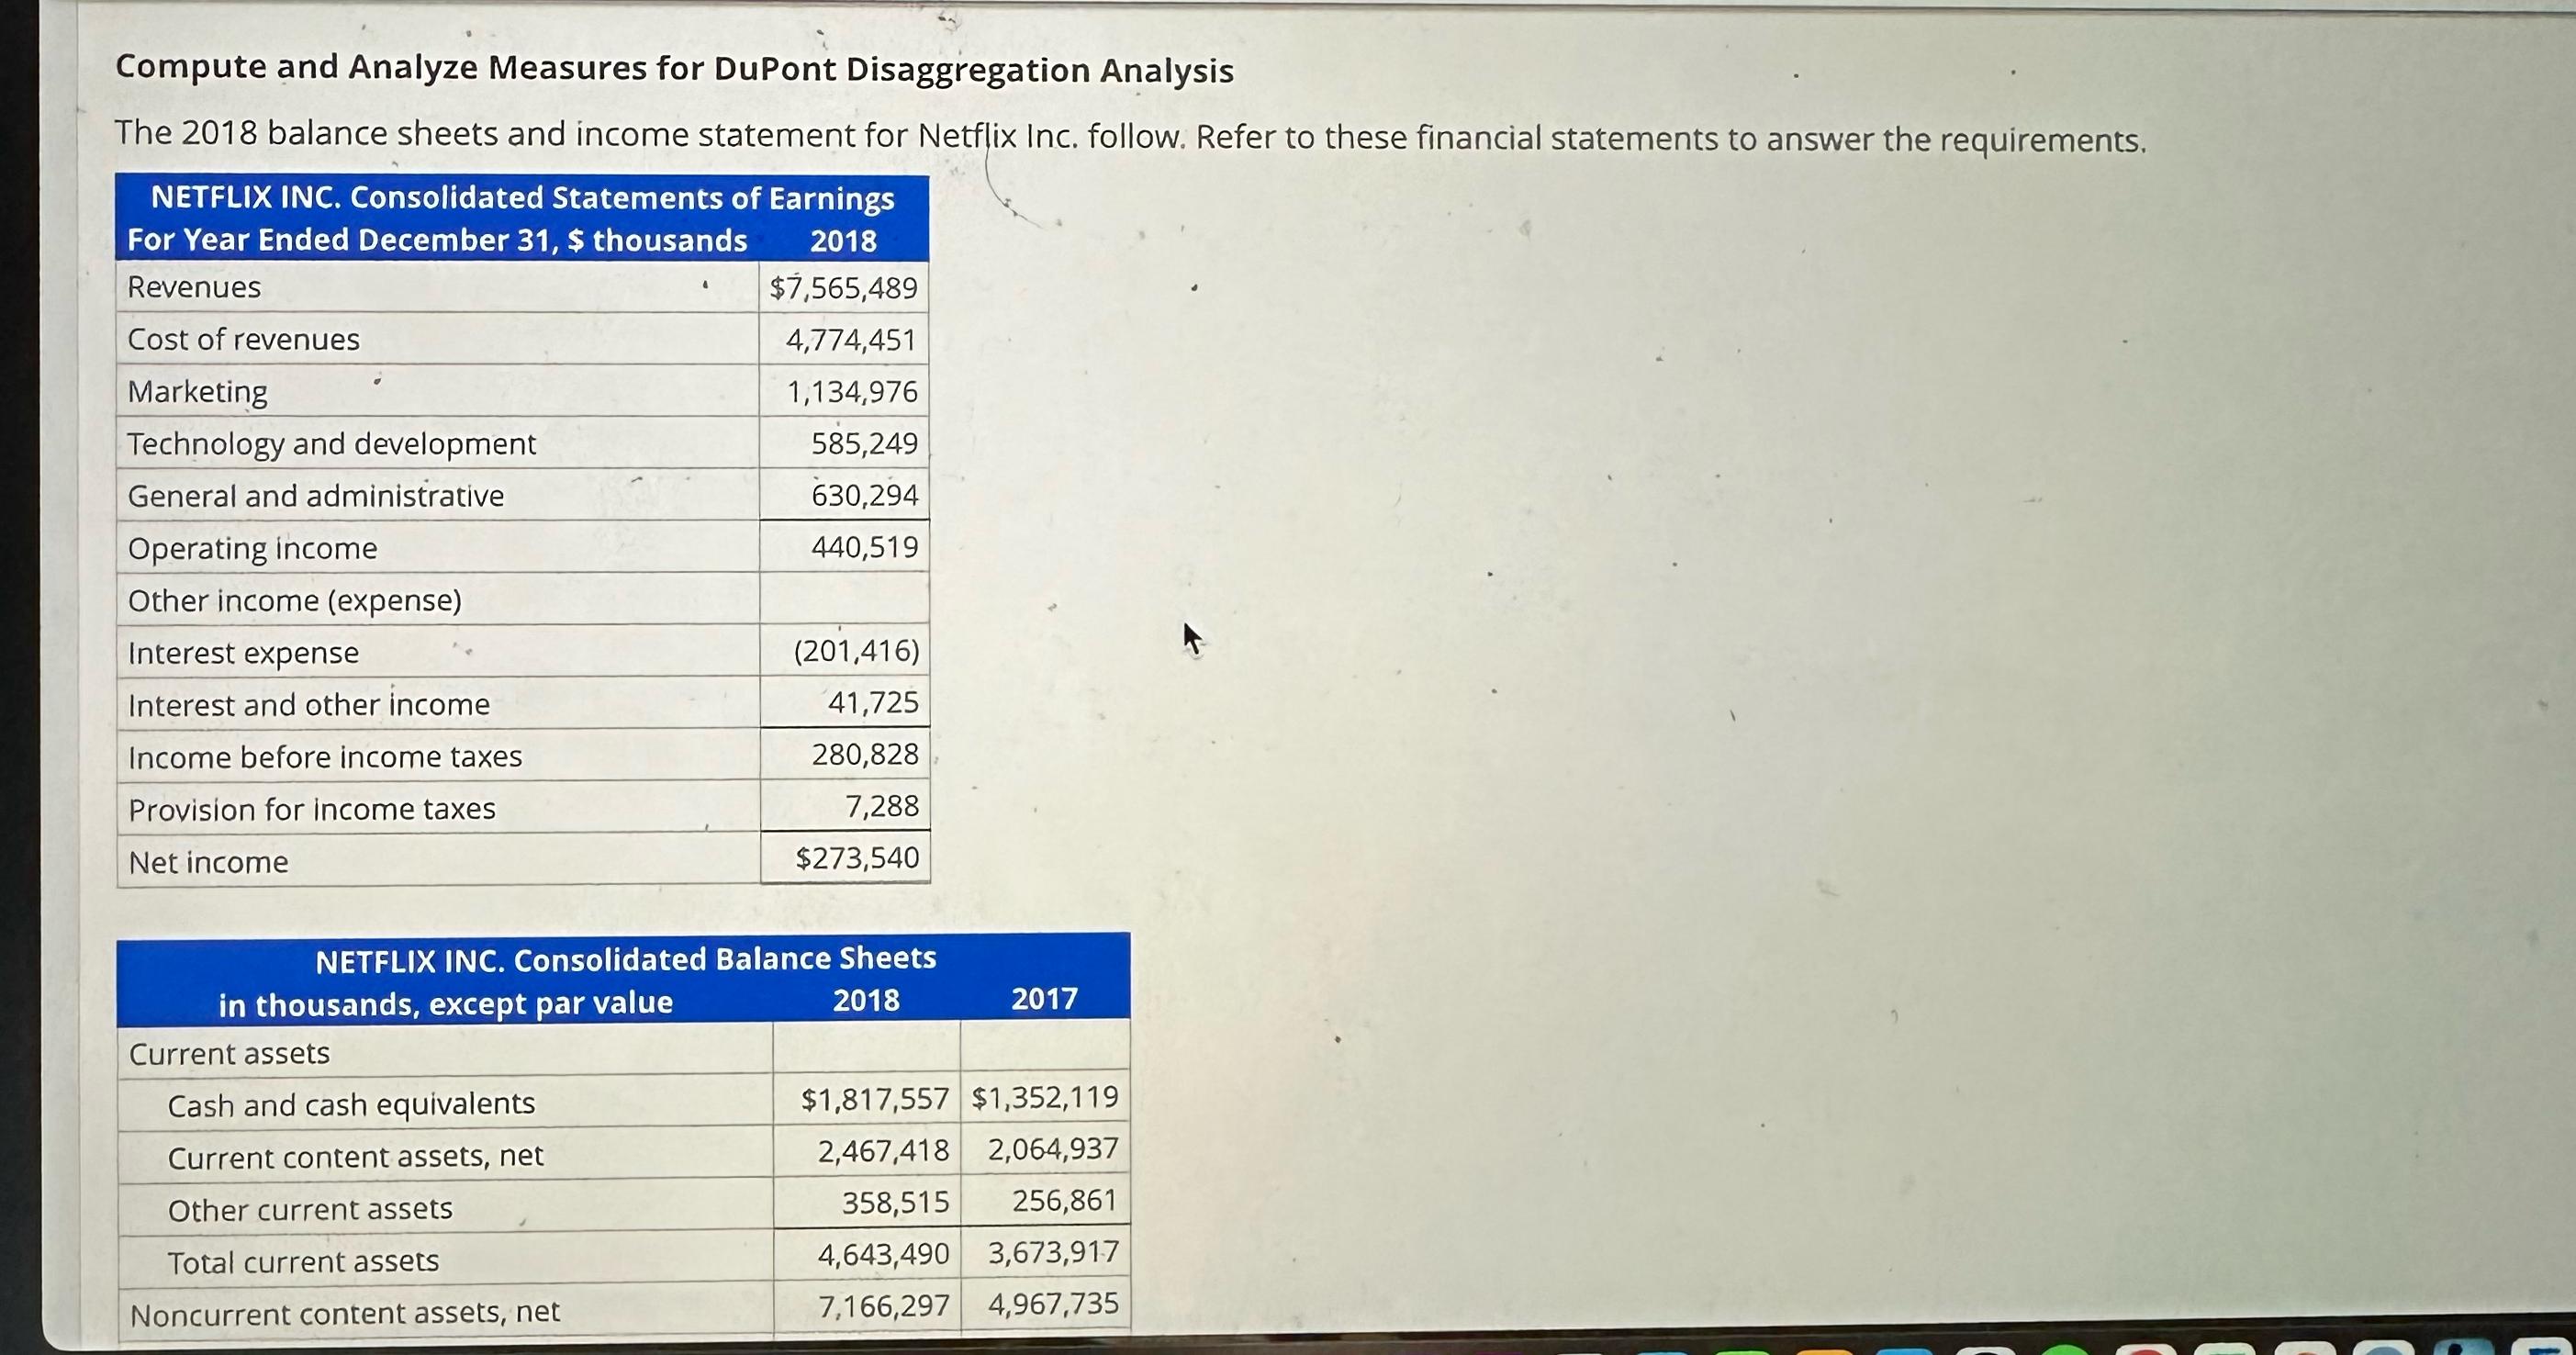
Compute and Analyze Measures for DuPont Disaggregation Analysis The 2018 balance sheets and income statement for Netflix Inc. follow. Refer to these financial statements

Compute and Analyze Measures for DuPont Disaggregation Analysis The 2018 balance sheets and income statement for Netflix Inc. follow. Refer to these financial statements to answer the requirements. NETFLIX INC. Consolidated Statements of Earnings For Year Ended December 31, $ thousands 2018 Revenues Cost of revenues Marketing Technology and development General and administrative Operating income $7,565,489 4,774,451 1,134,976 585,249 630,294 440,519 Other income (expense) Interest expense (201,416) Interest and other income 41,725 Income before income taxes 280,828 Provision for income taxes 7,288 Net income $273,540 NETFLIX INC. Consolidated Balance Sheets in thousands, except par value Current assets Cash and cash equivalents Current content assets, net Other current assets 2018 2017 $1,817,557 $1,352,119 2,467,418 2,064,937 358,515 256,861 4,643,490 3,673,917 Total current assets Noncurrent content assets, net 7,166,297 4,967,735
Step by Step Solution
There are 3 Steps involved in it
Step: 1

See step-by-step solutions with expert insights and AI powered tools for academic success
Step: 2

Step: 3

Ace Your Homework with AI
Get the answers you need in no time with our AI-driven, step-by-step assistance
Get Started


