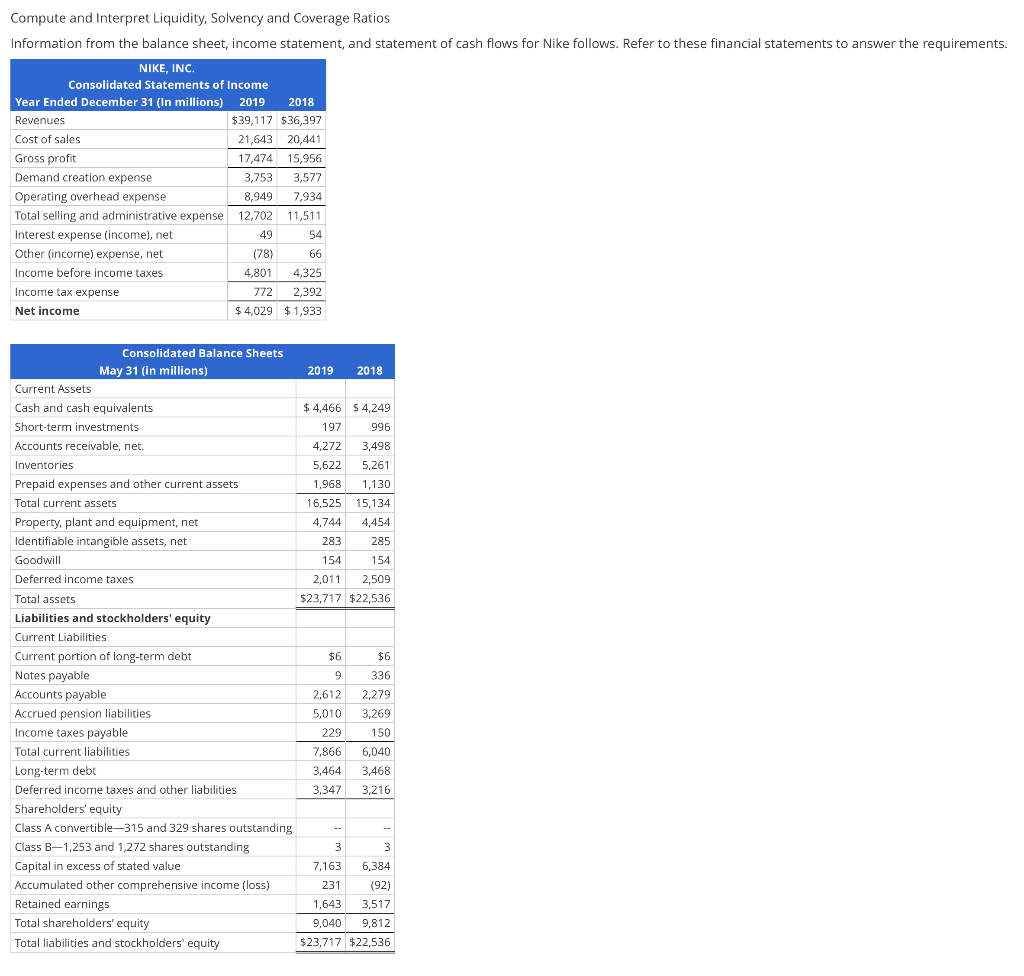
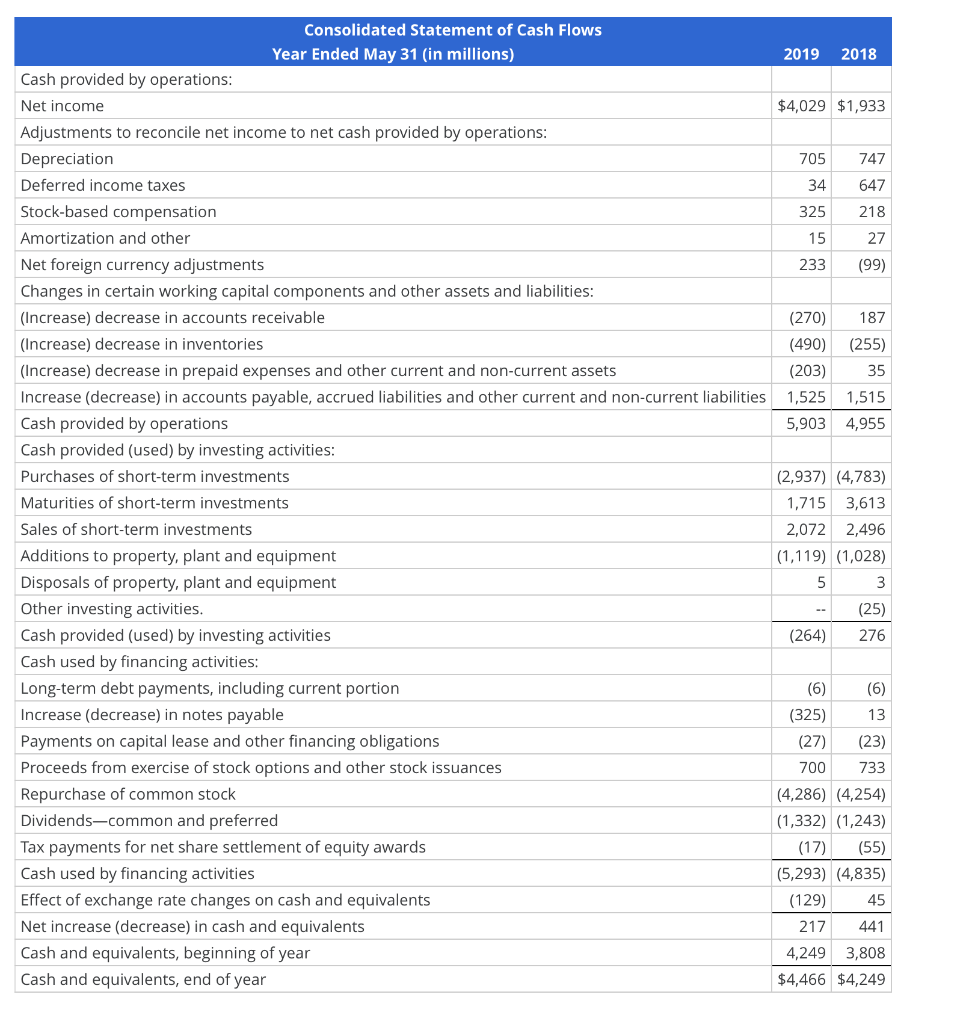
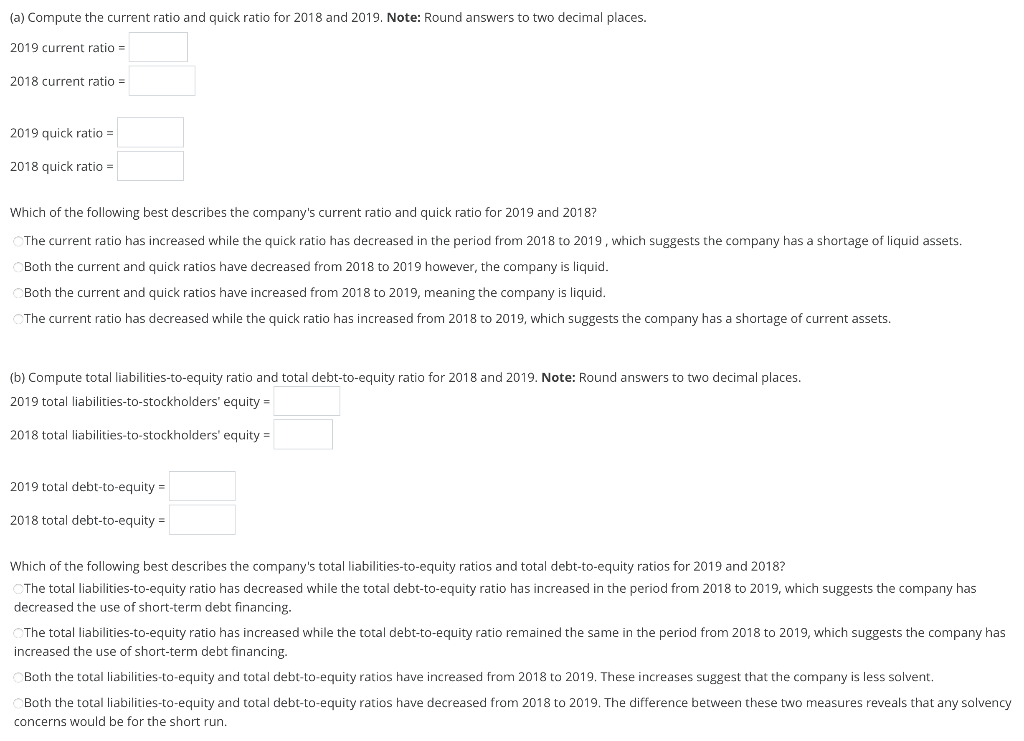
Compute and Interpret Liquidity, Solvency and Coverage Ratios Information from the balance sheet, income statement, and statement of cash flows for Nike follows. Refer to these financial statements to answer the requirements. NIKE, INC. Consolidated Statements of Income Year Ended December 31 (In millions) 2019 2018 Revenues $39,117 $36,397 Cost of sales 21,643 20,441 Gross profit 17,474 15,956 Demand creation expense 3,577 Operating overhead expense 8,949 7,934 Total selling and administrative expense 12,702 11,511 Interest expense (income), net 49 54 Other (income) expense, net ( (78) 66 Income before income taxes 4,801 4,325 Income tax expense 772 2,392 Net income $ 4,029 $1,933 3,753 2019 2018 $ 4,466 $ 4,249 197 996 4,272 3,498 5,622 5,261 1,968 1,130 16,525 15,134 4,744 4,454 285 283 154 154 2,011 2,509 $23,717 $22,536 Consolidated Balance Sheets May 31 (in millions) Current Assets Cash and cash equivalents Short-term investments Accounts receivable, net. Inventories Prepaid expenses and other current assets Total current assets Property, plant and equipment, net Identifiable intangible assets, net Goodwill Deferred income taxes Total assets Liabilities and stockholders' equity Current Liabilities Current portion of long-term debt Notes payable Accounts payable Accrued pension liabilities Income taxes payable Total current liabilities Long-term debt Deferred income taxes and other liabilities Shareholders' equity Class A convertible315 and 329 shares outstanding Class B,1,253 and 1,272 shares outstanding Capital in excess of stated value Accumulated other comprehensive income (loss) Retained earnings Total shareholders' equity Total liabilities and stockholders' equity $6 $6 9 2,612 5,010 229 336 2,279 3,269 150 6,040 3,468 3,216 7,866 3,464 3,347 -- 3 3 7,163 6,384 231 (92) 1,643 3,517 9,040 9,812 $23,717 $22,536 2019 2018 $4,029 $1,933 705 747 34 647 325 218 15 27 233 (99) (270) 187 (490) (255) (203) 35 1,525 1,515 5,903 4,955 Consolidated Statement of Cash Flows Year Ended May 31 (in millions) Cash provided by operations: Net income Adjustments to reconcile net income to net cash provided by operations: Depreciation Deferred income taxes Stock-based compensation Amortization and other Net foreign currency adjustments Changes in certain working capital components and other assets and liabilities: (Increase) decrease in accounts receivable (Increase) decrease in inventories (Increase) decrease in prepaid expenses and other current and non-current assets Increase (decrease) in accounts payable, accrued liabilities and other current and non-current liabilities Cash provided by operations Cash provided (used) by investing activities: Purchases of short-term investments Maturities of short-term investments Sales of short-term investments Additions to property, plant and equipment Disposals of property, plant and equipment Other investing activities. Cash provided (used) by investing activities Cash used by financing activities: Long-term debt payments, including current portion Increase (decrease) in notes payable Payments on capital lease and other financing obligations Proceeds from exercise of stock options and other stock issuances Repurchase of common stock Dividends-common and preferred Tax payments for net share settlement of equity awards Cash used financing activities Effect of exchange rate changes on cash and equivalents Net increase (decrease) in cash and equivalents Cash and equivalents, beginning of year Cash and equivalents, end of year (2,937) (4,783) 1,715 3,613 2,072 2,496 (1,119) (1,028) 5 3 (25) (264) 276 (6) (6) (325) 13 (27) (23) 700 733 (4,286) (4,254) (1,332) (1,243) (17) (55) (5,2 (4,835) (129) 45 217 441 4,249 3,808 $4,466 $4,249 (a) Compute the current ratio and quick ratio for 2018 and 2019. Note: Round answers to two decimal places. 2019 current ratio = 2018 current ratio = 2019 quick ratio = 2018 quick ratio = Which of the following best describes the company's current ratio and quick ratio for 2019 and 2018? The current ratio has increased while the quick ratio has decreased in the period from 2018 to 2019, which suggests the company has a shortage of liquid assets. Both the current and quick ratios have decreased from 2018 to 2019 however, the company is liquid. Both the current and quick ratios have increased from 2018 to 2019, meaning the company is liquid The current ratio has decreased while the quick ratio has increased from 2018 to 2019, which suggests the company has a shortage of current assets. (b) Compute total liabilities-to-equity ratio and total debt-to-equity ratio for 2018 and 2019. Note: Round answers to two decimal places. 2019 total liabilities-to-stockholders' equity = 2018 total liabilities-to-stockholders' equity = 2019 total debt-to-equity = 2018 total debt-to-equity = Which of the following best describes the company's total liabilities-to-equity ratios and total debt-to-equity ratios for 2019 and 2018? The total liabilities-to-equity ratio has decreased while the total debt-to-equity ratio has increased in the period from 2018 to 2019, which suggests the company has decreased the use of short-term debt financing. The total liabilities-to-equity ratio has increased while the total debt-to-equity ratio remained the same in the period from 2018 to 2019, which suggests the company has increased the use of short-term debt financing. Both the total liabilities-to-equity and total debt-to-equity ratios have increased from 2018 to 2019. These increases suggest that the company is less solvent, Both the total liabilities-to-equity and total debt-to-equity ratios have decreased from 2018 to 2019. The difference between these two measures reveals that any solvency concerns would be for the short run