Answered step by step
Verified Expert Solution
Link Copied!

Question

1 Approved Answer

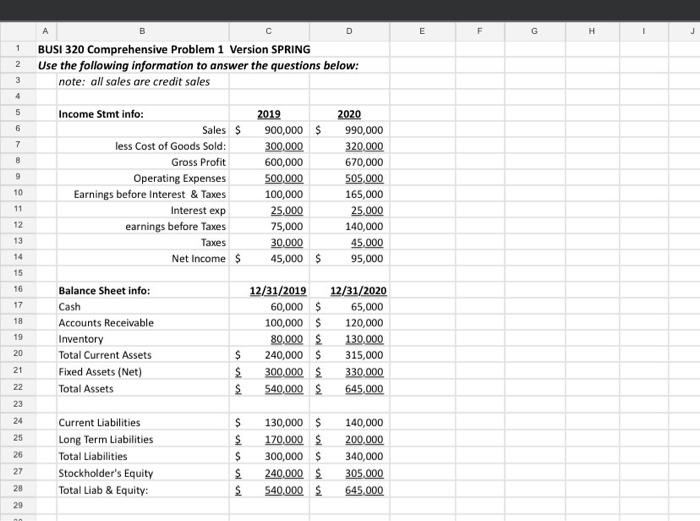
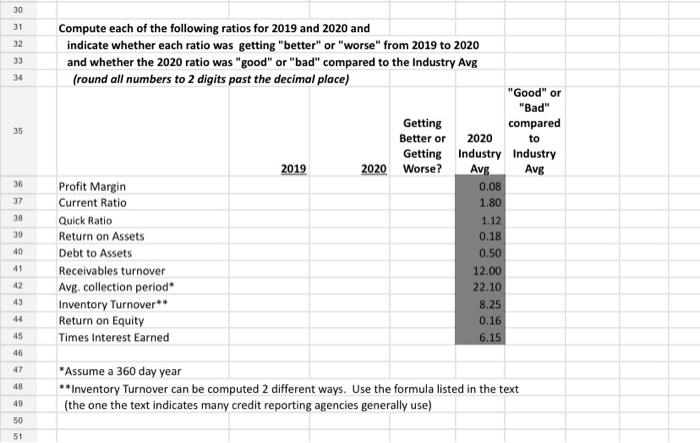
Compute each of the following ratios for 2019 and 2020 and i ndicate whether each ratio was getting better or worse from 2019 to 2020

Compute each of the following ratios for 2019 and 2020 and indicate whether each ratio was getting "better" or "worse" from 2019 to 2020 and whether the 2020 ratio was "good" or "bad" compared to the Industry Avg. Use the provided charts and numbers.
(round all numbers to 2 digits past the decimal place)
image text in transcribed
D E F G H J 1 2 3 4 5 BUSI 320 Comprehensive Problem 1 Version SPRING Use the following information to answer the questions below: note: all sales are credit sales 6 7 B 9 Income Stmt info: Sales less Cost of Goods Sold: Gross Profit Operating Expenses Earnings before Interest & Taxes Interest exp earnings before Taxes Taxes Net Income $ 10 2019 900,000 $ 300,000 600,000 500,000 100,000 25,000 75,000 30,000 45,000 $ 2020 990,000 320,000 670,000 505.000 165,000 25 000 140,000 45.000 95,000 11 12 13 Balance Sheet info: Cash Accounts Receivable Inventory Total Current Assets Fixed Assets (Net) Total Assets 999 & NSNN & 12/31/2019 60,000 $ 100,000 $ 80.000 $ 240,000 $ 300,000 540,000 $ 12/31/2020 65,000 120,000 130.000 315,000 330.000 645.000 21 $ $ $ $ $ Current Liabilities Long Term Liabilities Total Liabilities Stockholder's Equity Total Liab & Equity: ulu $ 130,000 $ 170,000 $ 300,000 $ 240,000 $ 540,000 $ 140,000 200.000 340,000 305.000 645.000 ul $ 30 31 32 33 35 36 Compute each of the following ratios for 2019 and 2020 and indicate whether each ratio was getting "better" or "worse" from 2019 to 2020 and whether the 2020 ratio was "good" or "bad" compared to the Industry Avg (round all numbers to 2 digits past the decimal place) "Good" or "Bad" Getting compared Better or 2020 to Getting industry Industry 2019 2020 Worse? Avg Avg Profit Margin 0.08 Current Ratio 1.80 Quick Ratio 1.12 Return on Assets 0.18 Debt to Assets 0.50 Receivables turnover 12.00 Avg. collection period 22.10 Inventory Turnover** 8.25 Return on Equity 0.16 Times Interest Earned 6.15 37 38 39 40 41 42 43 44 45 46 47 48 * *Assume a 360 day year **Inventory Turnover can be computed 2 different ways. Use the formula listed in the text (the one the text indicates many credit reporting agencies generally use) 49 50 51

Step by Step Solution

There are 3 Steps involved in it

Step: 1

blur-text-image

Get Instant Access to Expert-Tailored Solutions

See step-by-step solutions with expert insights and AI powered tools for academic success

Step: 2

blur-text-image

Step: 3

blur-text-image

Ace Your Homework with AI

Get the answers you need in no time with our AI-driven, step-by-step assistance

Get Started

Recommended Textbook for

How To Make Money With Junk Bonds

Authors: Robert Levine

1st Edition

007179381X,0071793828

More Books

Students also viewed these Finance questions