

Answered step by step
Verified Expert Solution
Question
1 Approved Answer
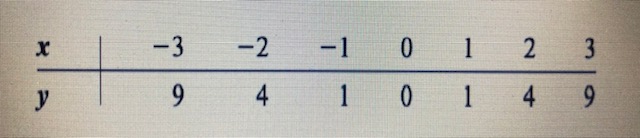
Compute r for the following data and test the hypothesis H0: r 0. Draw the scatter plot; then explain the results. X -3 -2 -1
Compute r for the following data and test the hypothesis H0: r 0. Draw the scatter plot; then explain the results.
Step by Step Solution
There are 3 Steps involved in it
Step: 1

Get Instant Access to Expert-Tailored Solutions
See step-by-step solutions with expert insights and AI powered tools for academic success
Step: 2

Step: 3
Ace Your Homework with AI
Get the answers you need in no time with our AI-driven, step-by-step assistance
Get Started
Algebra
Authors: Marvin L Bittinger
12th Edition
0321922913, 9780321922915