

Question
Compute RNOA and disaggregate RNOA into NOPM and NOAT for the most recent 2 years. Highlight the operating and nonoperating items in the income statements
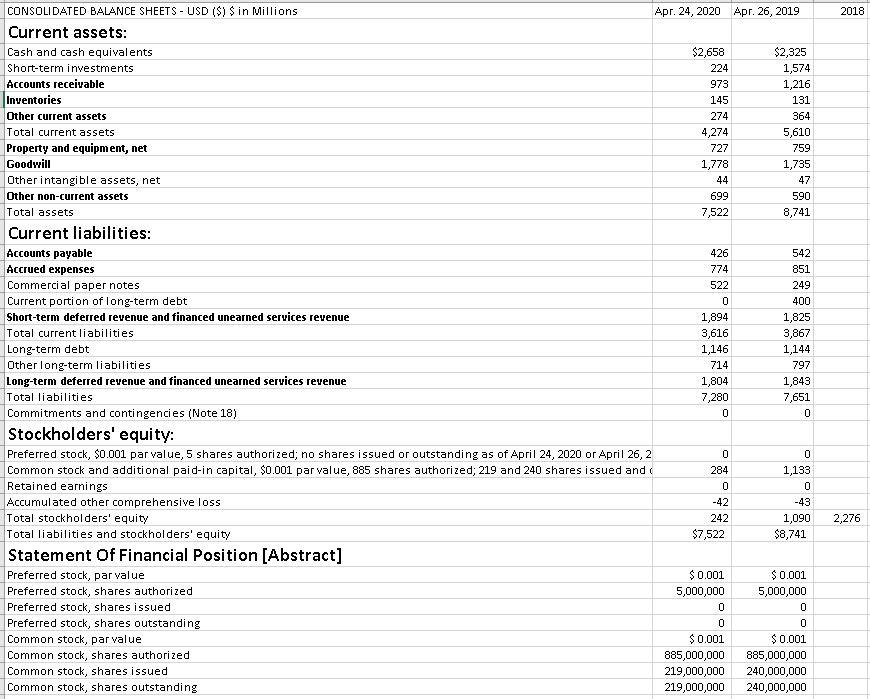
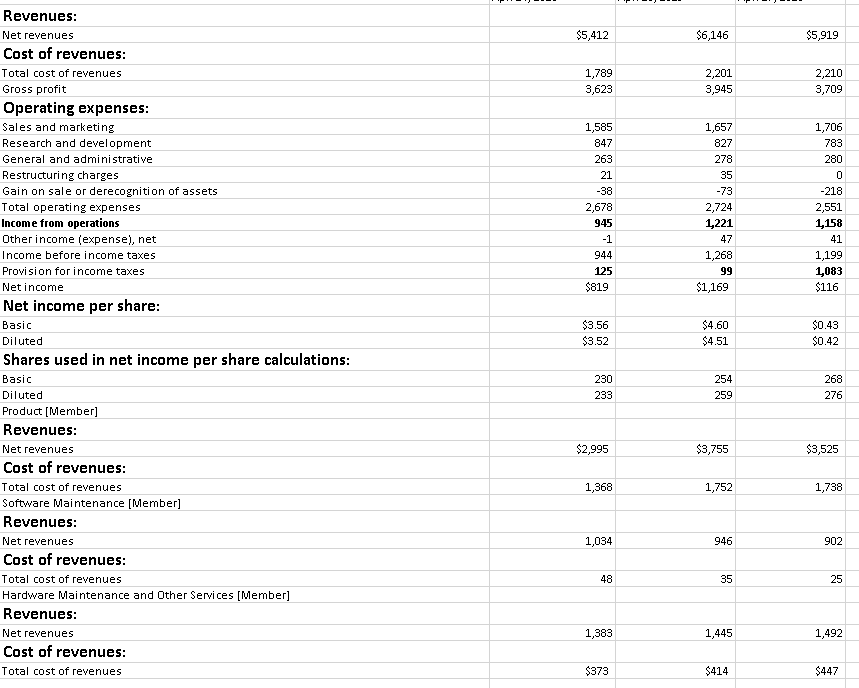
Compute RNOA and disaggregate RNOA into NOPM and NOAT for the most recent 2 years. Highlight the operating and nonoperating items in the income statements and balance sheets in different colors (in computing NOPAT, use the statutory tax rates reported in the note section of your companys 10-K report for each year).
The reported tax rate is 21%
2018 CONSOLIDATED BALANCE SHEETS - USD ($) S in Millions Apr. 24, 2020 Apr. 26, 2019 Current assets: Cash and cash equivalents $2,658 $2,325 Short-term investments 224 1,574 Accounts receivable 973 1,216 Inventories 145 131 Other current assets 274 364 Total current assets 4,274 5,610 Property and equipment, net 727 759 Goodwill 1,778 1,735 Other intangible assets, net 44 47 Other non-current assets 699 590 Total assets 7,522 8,741 Current liabilities: Accounts payable 426 542 Accrued expenses 774 851 Commercial paper notes 522 249 Current portion of long-term debt 0 400 Short-term deferred revenue and financed unearned services revenue 1,894 1,825 Total current liabilities 3,616 3,867 Long-term debt 1,146 1,144 Other long-term liabilities 714 797 Long-term deferred revenue and financed unearned services revenue 1,804 1,843 Total liabilities 7,280 7,651 Commitments and contingencies (Note 18) 0 0 Stockholders' equity: Preferred stock, $0.001 par value, 5 shares authorized; no shares issued or outstanding as of April 24, 2020 or April 26, 2 0 0 Common stock and additional paid-in capital, $0.001 par value, 885 shares authorized; 219 and 240 shares issued and 284 1,133 Retained earnings 0 0 Accumulated other comprehensive loss -42 -43 Total stockholders' equity 242 1,090 Total liabilities and stockholders' equity $7,522 $8,741 Statement of Financial Position [Abstract] Preferred stock, par value $ 0.001 $ 0.001 Preferred stock, shares authorized 5,000,000 5,000,000 Preferred stock, shares issued 0 0 Preferred stock, shares outstanding 0 0 Common stock, par value $0.001 $0.001 Common stock, shares authorized 885,000,000 885,000,000 Common stock, shares issued 219,000,000 240,000,000 Common stock, shares outstanding 219,000,000 240,000,000 2,276 $5,412 $6,146 $5,919 1,789 3,623 2,201 3,945 2,210 3,709 1,706 783 280 0 1,585 847 263 21 -38 2,678 945 -1 944 125 $819 1,657 827 278 35 -73 2,724 1,221 47 1,268 99 $1,169 -218 2,551 1,158 41 1,199 1,083 $116 Revenues: Net revenues Cost of revenues: Total cost of revenues Gross profit Operating expenses: Sales and marketing Research and development General and administrative Restructuring charges Gain on sale or derecognition of assets Total operating expenses Income from operations Other income (expense), net Income before income taxes Provision for income taxes Net income Net income per share: Basic Diluted Shares used in net income per share calculations: Basic Diluted Product (Member) Revenues: Net revenues Cost of revenues: Total cost of revenues Software Maintenance (Member) Revenues: Net revenues Cost of revenues: Total cost of revenues Hardware Maintenance and Other Services [Member] Revenues: Net revenues Cost of revenues: Total cost of revenues $3.56 $3.52 $4.60 $4.51 $0.43 $0.42 230 233 254 259 268 276 $2,995 $3,755 $3,525 1,368 1,752 1,738 1,034 946 902 48 35 25 1,383 1,445 1,492 $373 $414 $447 2018 CONSOLIDATED BALANCE SHEETS - USD ($) S in Millions Apr. 24, 2020 Apr. 26, 2019 Current assets: Cash and cash equivalents $2,658 $2,325 Short-term investments 224 1,574 Accounts receivable 973 1,216 Inventories 145 131 Other current assets 274 364 Total current assets 4,274 5,610 Property and equipment, net 727 759 Goodwill 1,778 1,735 Other intangible assets, net 44 47 Other non-current assets 699 590 Total assets 7,522 8,741 Current liabilities: Accounts payable 426 542 Accrued expenses 774 851 Commercial paper notes 522 249 Current portion of long-term debt 0 400 Short-term deferred revenue and financed unearned services revenue 1,894 1,825 Total current liabilities 3,616 3,867 Long-term debt 1,146 1,144 Other long-term liabilities 714 797 Long-term deferred revenue and financed unearned services revenue 1,804 1,843 Total liabilities 7,280 7,651 Commitments and contingencies (Note 18) 0 0 Stockholders' equity: Preferred stock, $0.001 par value, 5 shares authorized; no shares issued or outstanding as of April 24, 2020 or April 26, 2 0 0 Common stock and additional paid-in capital, $0.001 par value, 885 shares authorized; 219 and 240 shares issued and 284 1,133 Retained earnings 0 0 Accumulated other comprehensive loss -42 -43 Total stockholders' equity 242 1,090 Total liabilities and stockholders' equity $7,522 $8,741 Statement of Financial Position [Abstract] Preferred stock, par value $ 0.001 $ 0.001 Preferred stock, shares authorized 5,000,000 5,000,000 Preferred stock, shares issued 0 0 Preferred stock, shares outstanding 0 0 Common stock, par value $0.001 $0.001 Common stock, shares authorized 885,000,000 885,000,000 Common stock, shares issued 219,000,000 240,000,000 Common stock, shares outstanding 219,000,000 240,000,000 2,276 $5,412 $6,146 $5,919 1,789 3,623 2,201 3,945 2,210 3,709 1,706 783 280 0 1,585 847 263 21 -38 2,678 945 -1 944 125 $819 1,657 827 278 35 -73 2,724 1,221 47 1,268 99 $1,169 -218 2,551 1,158 41 1,199 1,083 $116 Revenues: Net revenues Cost of revenues: Total cost of revenues Gross profit Operating expenses: Sales and marketing Research and development General and administrative Restructuring charges Gain on sale or derecognition of assets Total operating expenses Income from operations Other income (expense), net Income before income taxes Provision for income taxes Net income Net income per share: Basic Diluted Shares used in net income per share calculations: Basic Diluted Product (Member) Revenues: Net revenues Cost of revenues: Total cost of revenues Software Maintenance (Member) Revenues: Net revenues Cost of revenues: Total cost of revenues Hardware Maintenance and Other Services [Member] Revenues: Net revenues Cost of revenues: Total cost of revenues $3.56 $3.52 $4.60 $4.51 $0.43 $0.42 230 233 254 259 268 276 $2,995 $3,755 $3,525 1,368 1,752 1,738 1,034 946 902 48 35 25 1,383 1,445 1,492 $373 $414 $447Step by Step Solution
There are 3 Steps involved in it
Step: 1

Get Instant Access to Expert-Tailored Solutions
See step-by-step solutions with expert insights and AI powered tools for academic success
Step: 2

Step: 3
Ace Your Homework with AI
Get the answers you need in no time with our AI-driven, step-by-step assistance
Get Started
Your Financial Future How To Take Control Of Your Financial Future
Authors: Deloris Lutke
1st Edition
979-8388730831