Compute the Cost of Equity and WACC for each division of Midland.Estimate the asset (unlevered) beta for the E&P and R&M divisions using the comparable firms.
Petrochemicals: You are not provided comparables for Petrochemicals. Solve for the asset beta using the steps below as the asset (unlevered) beta for Midland is a weighted average of the asset betas for each division.
1. Use the P/E multiples of 5.43 for E&P and 10.50 for R&M to estimate the value of equity for those divisions.
2. Then solve for the value of equity for Petrochemicals using Midlands value of equity and those for the first 2 divisions.
3. Estimate the enterprise value for Midland using the Equity/Value ratio.
4. Estimate the enterprise value for E&P and R&M using the Equity/Value weights 54% for E&P and 69% for R&M.
5. Solve for the enterprise value of Petrochemicals.
6. Using enterprise values as the weight solve for the asset beta for Petrochemicals.
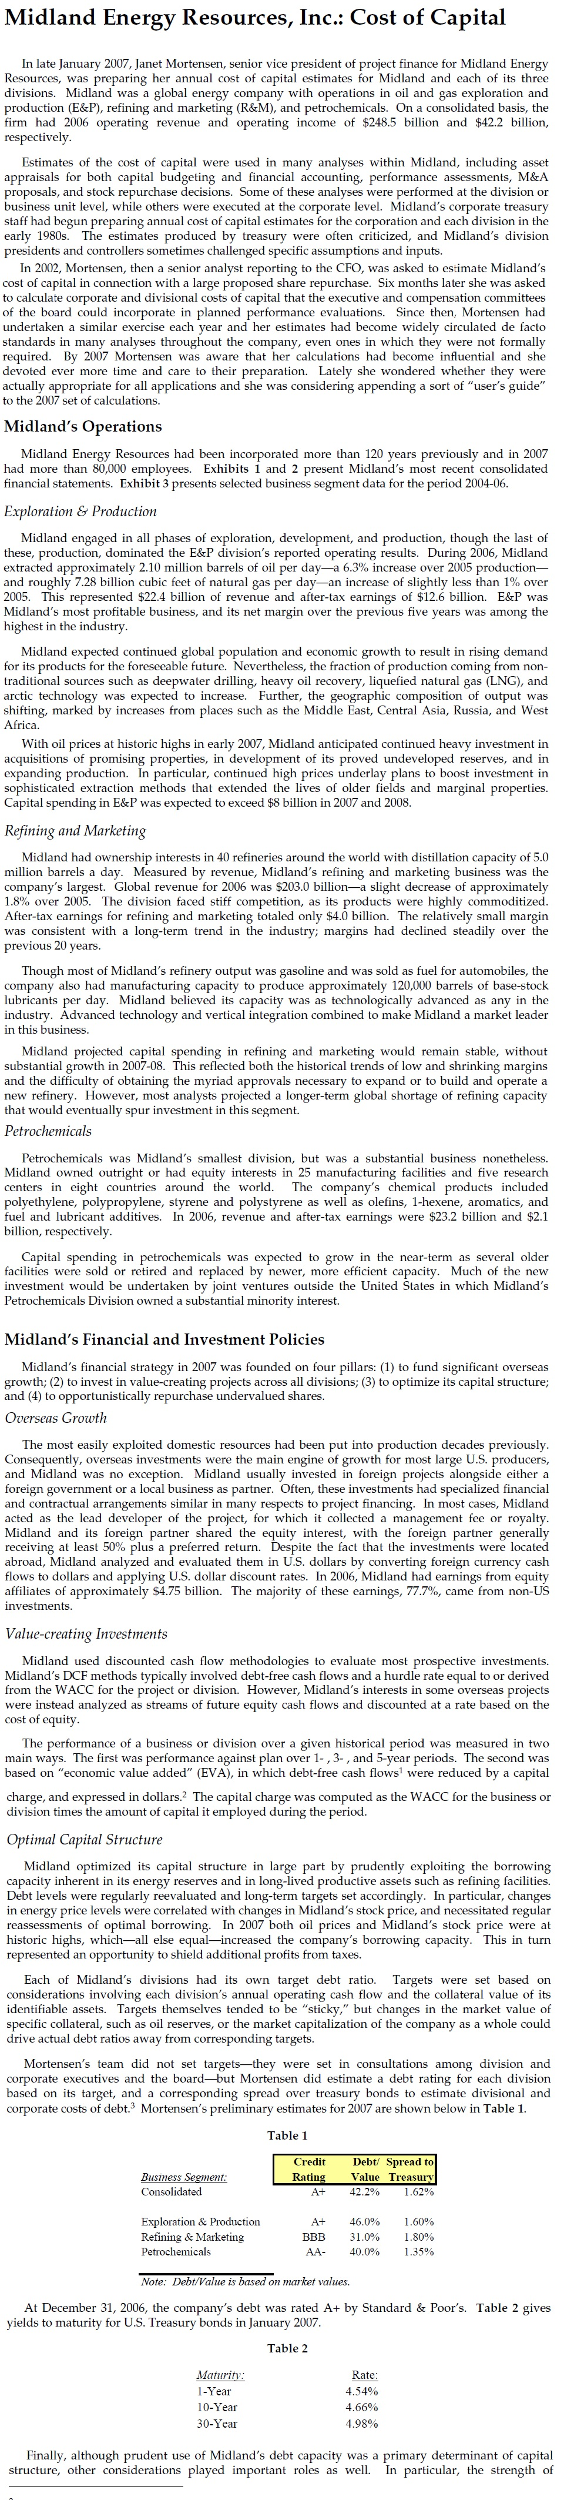
Midland Energy Resources, Inc.: Cost of Capital In late January 2007, Janet Mortensen, senior vice president of project finance for Midland Energy Resourcos, was preparing her annual cost of capital estimates for Midland and cach of its three divisions Midland was a global energy company with operations in oil and gas exploration and production (E&P), refining and marketing (R&M), and petrochemicals. On a consolidated basis, the firm had 2006 operating revenue and operating income of $248.5 billion and $422 billion, Estimates of the cost of capital were used in many analyses within Midland, including asset appraisals for both capital budgeting and financial accounting. performance assessments, M&A proposals, and stock repurchase decisions Some of these analyses were performed at the division or business unit level, while others were executed at the corporate level. Midland's corporate treasury staff had begun preparing annual cost of capital estimates for the corporation and each division in the early 1980s. The estimates produced by treasury were often criticized, and Midland's division presidents and controllers sometimes challenged specific assumptions and inputs In cost of capital in connection with a large proposed share repurchase. Six months later she was asked to calculate corporate and divisional costs of capital that the executive and compensation committees of the board could incorporate in planned performance evaluations. Since then, Mortensen had undertaken a similar exercise each year and her estimates had become widely circulated de facto standards in many analyses throughout the company, even ones in which they were not formally required. By 2007 Mortensen was aware that her calculations had become influential and she devoted ever more time and care to their preparation. Lately she wondered whether they were actually appropriate for all applications and she was considering appending a sort of "user's guide" to the 2007 set of calculations. to Midlan s Operations had more than 80,000 employees. Exhibits 1 and 2 present Midland's most recent consolidated financial statements. Exhibit 3 presents selected business segment data for the period 2004-06 Exploration &Production Midland engaged in all phases of exploration, development, and production, though the last of these, production, dominated theE&P division's reported operating results During 2006, Midland extracted approximately 2.10 million barrels of oil per day a 6.3% increase over 2005 production and roughly 728 billion cubic feet of natural gas per day-an increase of slightly less than 1% over 2005 This represented $22.4 billion of revenue and after-tax eamings of $126 billio E&P was Midland's most profitable business, and its net margin over the previous five years was among the Midland expected continued global population and economic growth to result in rising demand coming from non traditional sources such as deepwater driling, heavy oil recovery, liquefied natural gas (LNG), and arctic technology was expected to increase. Further, the geographic composition of output was shifting, marked by increases from places such as the Middle East, Central Asia, Russia, and West its products for the foresocable future the fraction With oil prices at historic highs in early 2007, Midland continued heavy acquisitions of promising properties, in development of its proved undeveloped reserves, and in expanding production. In particular, continued high prices underlay plans to boost investment in sophisticated extraction methods that extended the lives of older fields and marginal properties. Capital spending in E&P was expected to exceed $8 billion in 2007 and 2008. ing Midland had ownership interests in 40 refineries around the world with distillation capacity of 5.0 million barrels a day. Measured by revenue, Midland's refining and marketing business was the company's largest. Global revenue for 2006 was $203.0 billion-a slight decrease of approximately 1.8% over 2005. The division faced stiff competition, as its products were highly commoditized. y S4.0 billion. The relatively small margin was consistent with a long-term trend in the industry; margins had declined steadily over the tot aled onl previous 20 Though most of Midland's refinery output was gasoline and was sold as fuel for automobiles, the lubricants per day. Midland believed its capacity was as technologically advanced as any in the industry. Advanced technology and vertical integration combined to make Midland a market leader Midland projected capital spending in refining and marketing would remain stable, without subslantial growth in 2007-08. This reflected both the historical trends of low and shrinking margins and the difficulty of obtaining the myriad approvals necessary to expand or to build and operate a However of t wouldowver entlysr. ooh take Petrochemicals was Midland's smallest division, but was a substantial business nonetheless. Midland owned outright or had equity interests in 25 manufacturing facilities and five research The company's centers in polyethyl fuel and lubricant additives. In 2006, revenue and after-tax earnings were $23.2 billion and $2.1 ucts billion, facilities Pend investment would be undertaken by joint ventures outside the United States in which Midland's efficient capacity Petrochemicals Division owned a substantial minority interest. Midland's Financial and Investment Policies Midland's financial strategy in 2007 was founded on four pillars (1) to fund significant overseas growth: (2) to invest in value-creating projects across all divisions; (3) to optimize its capital structure: Growth The most easily exploited domestic resources had been put into production decades previously. Consequently, overseas investments were the main engine of growth for most large U.S. producers, foreign government or a local business as partner. Often, these investments had specialized financial and contractual arrangements similar in many respects to project financing. In most cases, Midland acted as the lead developer of the project, for which it collected a management fee or royalty. interest, with the foreign partner generally the fact that the investments were located abroad, Midland analyzed and evaluated them in US. dollars by converting foreign currency cash flows to dollars and applying US. dollar discount rates. In 2006, Midland had earnings from equity affiliates of approximately $475 billion. The majority of these carnings, 77.7%, carne from non-US Value-creating Imvestments Midland used discounted cash flow methodologies to evaluate most prospective investments. Midland's DCF methods typically involved debt-free cash flows and a hurdle rate equal to or derived from the WACC for the project or division. However, Midland's interests in some overseas projects were instead analyzed as streams of future equity cash flows and discounted at a rate based on the or division over a given historical period was m main ways. The first was performance against plan over 1-,3, and 5-year periods. The second was based on "economic value added" (EVA), in which debt-free cash flows were reduced by a capital charge, and expressed in dollars division times the a The capital charge was computed as the WACC for the business or the capital it Midland optimized its capital strte in large part by prudently exploiting the borrowing capacity inherent in its energy reserves and in long-lived productive assets such as refining facilities Debt levels were regularly reevaluated and long-term targets set accordingly. In particular, changes in energy price levels were correlated with changes in Midland's stock price, and necessitated regular and Midland's stock price were at historic highs, which-all else equal-increased the company's borrowing capacity. This in turn of In 2007 both oil prices represented an opportunity to shield additional profits from taxes Each of Midland's divisions had its own target deb ratio Targets were set based on considerations involving each division's annual operating cash flow and the collateral value of its themselves tended to be "sticky specific collateral, such as oil reserves, or the market capitalization of the company as a whole could drive actual debt ratios away from corresponding targets. Mortensen's team did not set targets-they were set in consultations among division and corporate executives and the board-but Mortensen did estimate a debt ating for each division based on its target, and a corresponding spread over treasury bonds to estimate divisional and corporate costs of debt3 Mortensen's preliminary estimates for 2007 are shown below in Table 1. A+ 46.0% 1.60% 400% waariet vaines At December 31, 2006, the company's debt was rated A+ by Standard & Poors. Table 2 gives 4.66% 4.98% 10-Year Finally, although prudent use of Midland's debt capacity was a primary determinant of capital structure, other considerations played important roles as well In particular, the strength of Midland Energy Resources, Inc.: Cost of Capital In late January 2007, Janet Mortensen, senior vice president of project finance for Midland Energy Resourcos, was preparing her annual cost of capital estimates for Midland and cach of its three divisions Midland was a global energy company with operations in oil and gas exploration and production (E&P), refining and marketing (R&M), and petrochemicals. On a consolidated basis, the firm had 2006 operating revenue and operating income of $248.5 billion and $422 billion, Estimates of the cost of capital were used in many analyses within Midland, including asset appraisals for both capital budgeting and financial accounting. performance assessments, M&A proposals, and stock repurchase decisions Some of these analyses were performed at the division or business unit level, while others were executed at the corporate level. Midland's corporate treasury staff had begun preparing annual cost of capital estimates for the corporation and each division in the early 1980s. The estimates produced by treasury were often criticized, and Midland's division presidents and controllers sometimes challenged specific assumptions and inputs In cost of capital in connection with a large proposed share repurchase. Six months later she was asked to calculate corporate and divisional costs of capital that the executive and compensation committees of the board could incorporate in planned performance evaluations. Since then, Mortensen had undertaken a similar exercise each year and her estimates had become widely circulated de facto standards in many analyses throughout the company, even ones in which they were not formally required. By 2007 Mortensen was aware that her calculations had become influential and she devoted ever more time and care to their preparation. Lately she wondered whether they were actually appropriate for all applications and she was considering appending a sort of "user's guide" to the 2007 set of calculations. to Midlan s Operations had more than 80,000 employees. Exhibits 1 and 2 present Midland's most recent consolidated financial statements. Exhibit 3 presents selected business segment data for the period 2004-06 Exploration &Production Midland engaged in all phases of exploration, development, and production, though the last of these, production, dominated theE&P division's reported operating results During 2006, Midland extracted approximately 2.10 million barrels of oil per day a 6.3% increase over 2005 production and roughly 728 billion cubic feet of natural gas per day-an increase of slightly less than 1% over 2005 This represented $22.4 billion of revenue and after-tax eamings of $126 billio E&P was Midland's most profitable business, and its net margin over the previous five years was among the Midland expected continued global population and economic growth to result in rising demand coming from non traditional sources such as deepwater driling, heavy oil recovery, liquefied natural gas (LNG), and arctic technology was expected to increase. Further, the geographic composition of output was shifting, marked by increases from places such as the Middle East, Central Asia, Russia, and West its products for the foresocable future the fraction With oil prices at historic highs in early 2007, Midland continued heavy acquisitions of promising properties, in development of its proved undeveloped reserves, and in expanding production. In particular, continued high prices underlay plans to boost investment in sophisticated extraction methods that extended the lives of older fields and marginal properties. Capital spending in E&P was expected to exceed $8 billion in 2007 and 2008. ing Midland had ownership interests in 40 refineries around the world with distillation capacity of 5.0 million barrels a day. Measured by revenue, Midland's refining and marketing business was the company's largest. Global revenue for 2006 was $203.0 billion-a slight decrease of approximately 1.8% over 2005. The division faced stiff competition, as its products were highly commoditized. y S4.0 billion. The relatively small margin was consistent with a long-term trend in the industry; margins had declined steadily over the tot aled onl previous 20 Though most of Midland's refinery output was gasoline and was sold as fuel for automobiles, the lubricants per day. Midland believed its capacity was as technologically advanced as any in the industry. Advanced technology and vertical integration combined to make Midland a market leader Midland projected capital spending in refining and marketing would remain stable, without subslantial growth in 2007-08. This reflected both the historical trends of low and shrinking margins and the difficulty of obtaining the myriad approvals necessary to expand or to build and operate a However of t wouldowver entlysr. ooh take Petrochemicals was Midland's smallest division, but was a substantial business nonetheless. Midland owned outright or had equity interests in 25 manufacturing facilities and five research The company's centers in polyethyl fuel and lubricant additives. In 2006, revenue and after-tax earnings were $23.2 billion and $2.1 ucts billion, facilities Pend investment would be undertaken by joint ventures outside the United States in which Midland's efficient capacity Petrochemicals Division owned a substantial minority interest. Midland's Financial and Investment Policies Midland's financial strategy in 2007 was founded on four pillars (1) to fund significant overseas growth: (2) to invest in value-creating projects across all divisions; (3) to optimize its capital structure: Growth The most easily exploited domestic resources had been put into production decades previously. Consequently, overseas investments were the main engine of growth for most large U.S. producers, foreign government or a local business as partner. Often, these investments had specialized financial and contractual arrangements similar in many respects to project financing. In most cases, Midland acted as the lead developer of the project, for which it collected a management fee or royalty. interest, with the foreign partner generally the fact that the investments were located abroad, Midland analyzed and evaluated them in US. dollars by converting foreign currency cash flows to dollars and applying US. dollar discount rates. In 2006, Midland had earnings from equity affiliates of approximately $475 billion. The majority of these carnings, 77.7%, carne from non-US Value-creating Imvestments Midland used discounted cash flow methodologies to evaluate most prospective investments. Midland's DCF methods typically involved debt-free cash flows and a hurdle rate equal to or derived from the WACC for the project or division. However, Midland's interests in some overseas projects were instead analyzed as streams of future equity cash flows and discounted at a rate based on the or division over a given historical period was m main ways. The first was performance against plan over 1-,3, and 5-year periods. The second was based on "economic value added" (EVA), in which debt-free cash flows were reduced by a capital charge, and expressed in dollars division times the a The capital charge was computed as the WACC for the business or the capital it Midland optimized its capital strte in large part by prudently exploiting the borrowing capacity inherent in its energy reserves and in long-lived productive assets such as refining facilities Debt levels were regularly reevaluated and long-term targets set accordingly. In particular, changes in energy price levels were correlated with changes in Midland's stock price, and necessitated regular and Midland's stock price were at historic highs, which-all else equal-increased the company's borrowing capacity. This in turn of In 2007 both oil prices represented an opportunity to shield additional profits from taxes Each of Midland's divisions had its own target deb ratio Targets were set based on considerations involving each division's annual operating cash flow and the collateral value of its themselves tended to be "sticky specific collateral, such as oil reserves, or the market capitalization of the company as a whole could drive actual debt ratios away from corresponding targets. Mortensen's team did not set targets-they were set in consultations among division and corporate executives and the board-but Mortensen did estimate a debt ating for each division based on its target, and a corresponding spread over treasury bonds to estimate divisional and corporate costs of debt3 Mortensen's preliminary estimates for 2007 are shown below in Table 1. A+ 46.0% 1.60% 400% waariet vaines At December 31, 2006, the company's debt was rated A+ by Standard & Poors. Table 2 gives 4.66% 4.98% 10-Year Finally, although prudent use of Midland's debt capacity was a primary determinant of capital structure, other considerations played important roles as well In particular, the strength of