Answered step by step
Verified Expert Solution
Question
1 Approved Answer
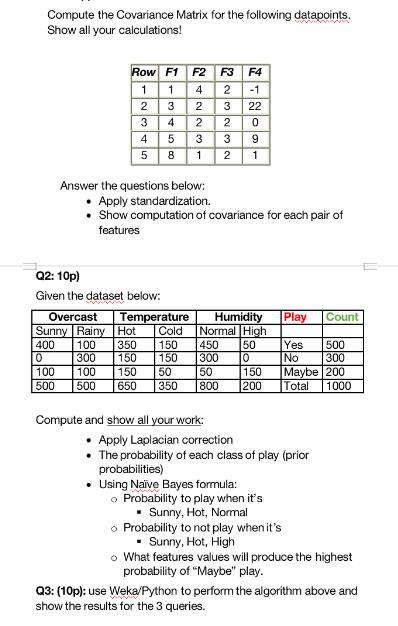
Compute the Covariance Matrix for the following datapoints. Show all your calculations! Row F1 F2 F3 1 14 2 2 2 3 1 2

Compute the Covariance Matrix for the following datapoints. Show all your calculations! Row F1 F2 F3 1 14 2 2 2 3 1 2 3 4 5 3 4 5 8 NWNWN 2 3 450 300 50 800 Compute and show all your work: 2 3 2 Answer the questions below: Apply standardization. Show computation of covariance for each pair of features F4 -1 22 0 9 1 Q2: 10p) Given the dataset below: Overcast Temperature Humidity Sunny Rainy Hot Cold Normal High 400 100 350 150 50 0 300 150 150 100 100 150 50 500 500 650 350 10 150 200 o Probability to play when it's Sunny, Hot, Normal Play Count o Probability to not play when it's Sunny, Hot, High Yes No Apply Laplacian correction The probability of each class of play (prior probabilities) Using Nave Bayes formula: 500 300 Maybe 200 Total 1000 o What features values will produce the highest probability of "Maybe" play. Q3: (10p): use Weka/Python to perform the algorithm above and show the results for the 3 queries.
Step by Step Solution
★★★★★
3.40 Rating (150 Votes )
There are 3 Steps involved in it
Step: 1
Q1 Covariance Matrix Calculation To compute the covariance matrix for the given data points we first need to standardize the data and then calculate t...
Get Instant Access to Expert-Tailored Solutions
See step-by-step solutions with expert insights and AI powered tools for academic success
Step: 2

Step: 3

Ace Your Homework with AI
Get the answers you need in no time with our AI-driven, step-by-step assistance
Get Started


