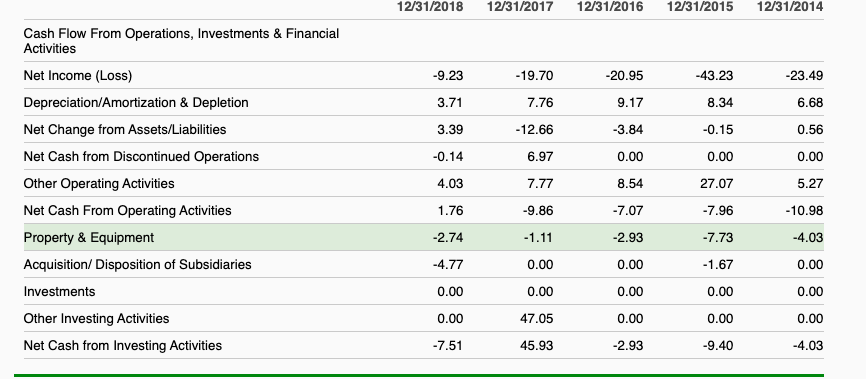
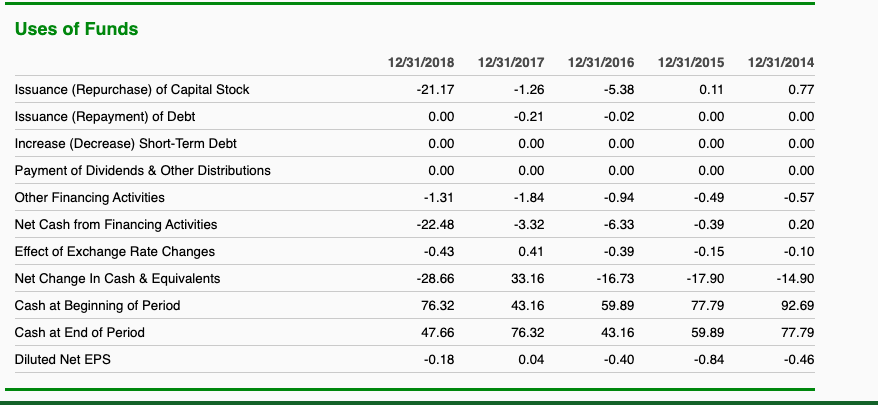
- Compute the following financial ratios for the company:
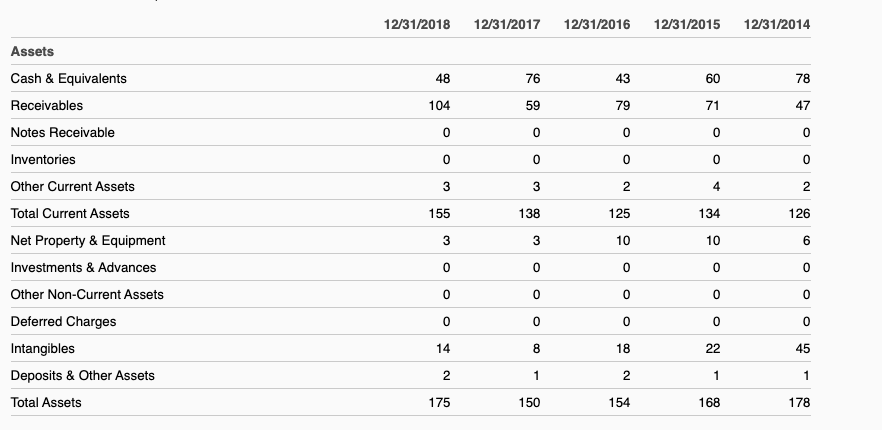
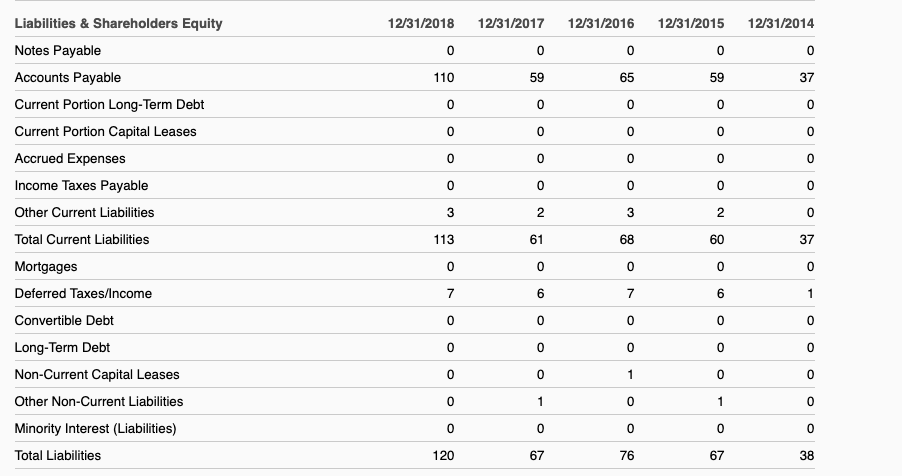
- Current ratio
- Acid-test ratio (also known as the Quick ratio)
- Operating return on assets
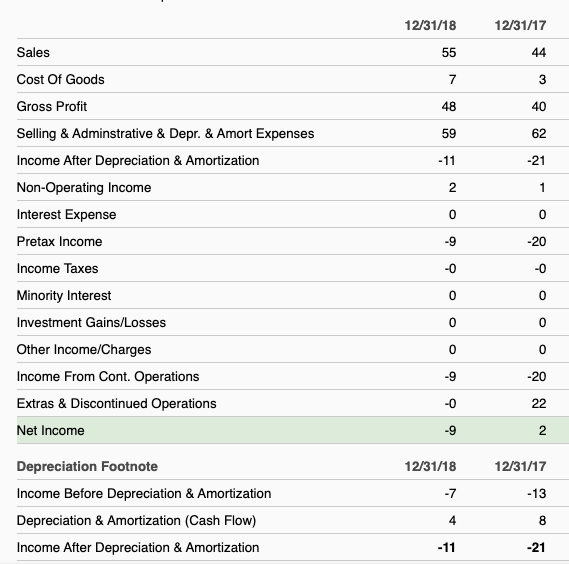
- Gross profit margin
- Operating profit margin
- Net profit margin
- Total asset turnover (TATO)
- Fixed asset turnover (FATO)
- Times interest earned (TIE)
- Debt ratio
- Return on equity (ROE)
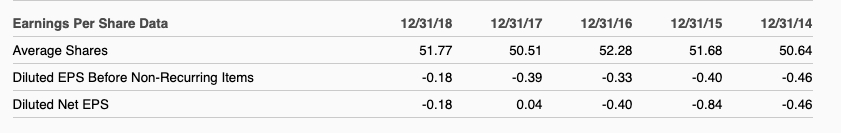
- Price/Earnings ratio (P/E)
- Market/Book ratio
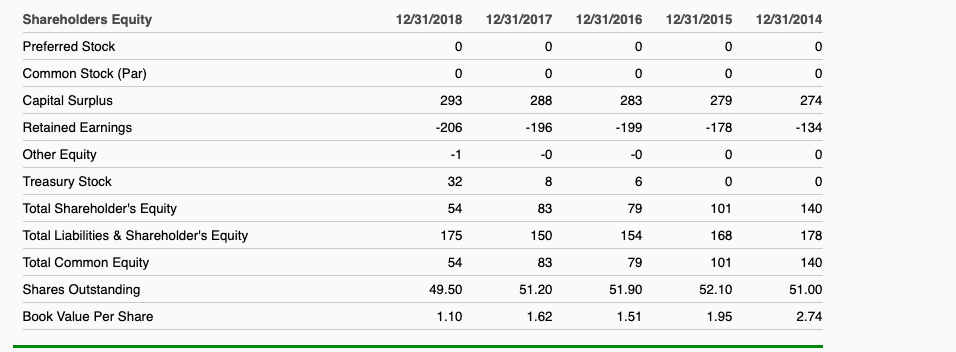
12/31/18 12/31/17 Sales Cost Of Goods Gross Profit Selling & Adminstrative & Depr. & Amort Expenses Income After Depreciation & Amortization Non-Operating Income Interest Expense Pretax Income -11 -21 -20 Income Taxes Minority Interest Investment Gains/Losses Other Income/Charges 0 0 00 -9 -20 - 0 22 Income From Cont. Operations Extras & Discontinued Operations Net Income - 92 12/31/18 Depreciation Footnote Income Before Depreciation & Amortization Depreciation & Amortization (Cash Flow) Income After Depreciation & Amortization 12/31/17 -13 8 -21 4 -11 Earnings Per Share Data Average Shares Diluted EPS Before Non-Recurring Items Diluted Net EPS 12/31/18 51.77 -0.18 -0.18 12/31/17 50.51 -0.39 0.04 12/31/16 52.28 -0.33 -0.40 12/31/15 51.68 -0.40 -0.84 12/31/14 50.64 -0.46 -0.46 12/31/2018 12/31/2017 12/31/2016 12/31/2015 12/31/2014 Assets Cash & Equivalents Receivables R 436078 79 7 47 0 0 0 0 Notes Receivable Inventories Other Current Assets Total Current Assets 76 104 59 0 0 0 33 138 3 3 0 0 0 0 0 8 Net Property & Equipment Investments & Advances Other Non-Current Assets Deferred Charges Intangibles Deposits & Other Assets Total Assets 125 10 0 0 0 18 134 10 0 0 0 22 175 150 154 168 Liabilities & Shareholders Equity 12/31/2018 12/31/2017 12/31/2016 12/31/2015 12/31/2014 Notes Payable Accounts Payable Current Portion Long-Term Debt Current Portion Capital Leases Accrued Expenses Income Taxes Payable Other Current Liabilities 110 596559 0 0 0 0 0 0 0 0 0 0 0 0 0 0 0 0 0 0 0 0 3232 11361686037 0 0 0 0 Total Current Liabilities 0 0 Mortgages Deferred Taxes/Income Convertible Debt Long-Term Debt Non-Current Capital Leases Other Non-Current Liabilities Minority Interest (Liabilities) Total Liabilities 0 0 0 0 0 0 0 1 0 0 12067 0 0 1 0 0 1 0 0 67 12/31/2018 12/31/2017 12/31/2016 12/31/2015 12/31/2014 0 0 0 Shareholders Equity Preferred Stock Common Stock (Par) Capital Surplus Retained Earnings Other Equity 293 0 283 -199 0 279 -178 274 -206 -1 32 54 175 0 288 -196 0 8 83 140 178 150 Treasury Stock Total Shareholder's Equity Total Liabilities & Shareholder's Equity Total Common Equity Shares Outstanding Book Value Per Share 6 79 154 79 51.90 1.51 101 168 101 52.10 83 140 49.50 1.10 51.20 1.62 51.00 2.74 1.95 12/31/2018 12/31/2017 12/31/2016 12/31/2015 12/31/2014 Cash Flow From Operations, Investments & Financial Activities -23.49 Net Income (Loss) Depreciation/Amortization & Depletion -9.23 3.71 -43.23 8.34 6.68 Net Change from Assets/Liabilities 3.39 -0.14 -19.70 7.76 -12.66 6.97 7.77 -9.86 -1.11 -20.95 9.17 -3.84 0.00 8.54 -7.07 -2.93 -0.15 0.00 27.07 -7.96 -7.73 0.56 0.00 5.27 -10.98 Net Cash from Discontinued Operations Other Operating Activities Net Cash From Operating Activities Property & Equipment Acquisition/Disposition of Subsidiaries Investments Other Investing Activities Net Cash from Investing Activities 4.03 1.76 -2.74 -4.77 0.00 0.00 0.00 0.00 -1.67 0.00 0.00 47.05 -4.03 0.00 0.00 0.00 -4.03 0.00 0.00 -9.40 0.00 -7.51 45.93 -2.93 Uses of Funds 12/31/2017 12/31/2014 -1.26 0.77 Issuance (Repurchase) of Capital Stock Issuance (Repayment) of Debt Increase (Decrease) Short-Term Debt Payment of Dividends & Other Distributions 12/31/2018 -21.17 0.00 0.00 0.00 -1.31 12/31/2016 -5.38 -0.02 0.00 -0.21 0.00 0.00 12/31/2015 0.11 0.00 0.00 0.00 0.00 0.00 0.00 0.00 -1.84 -0.94 -0.49 -0.57 -22.48 -6.33 0.20 -0.43 -0.39 -0.10 Other Financing Activities Net Cash from Financing Activities Effect of Exchange Rate Changes Net Change In Cash & Equivalents Cash at Beginning of Period Cash at End of Period Diluted Net EPS -28.66 - 16.73 - 14.90 -3.32 0.41 33.16 43.16 76.32 0.04 -0.39 -0.15 -17.90 77.79 59.89 -0.84 59.89 92.69 76.32 47.66 -0.18 43.16 77.79 -0.40 -0.46