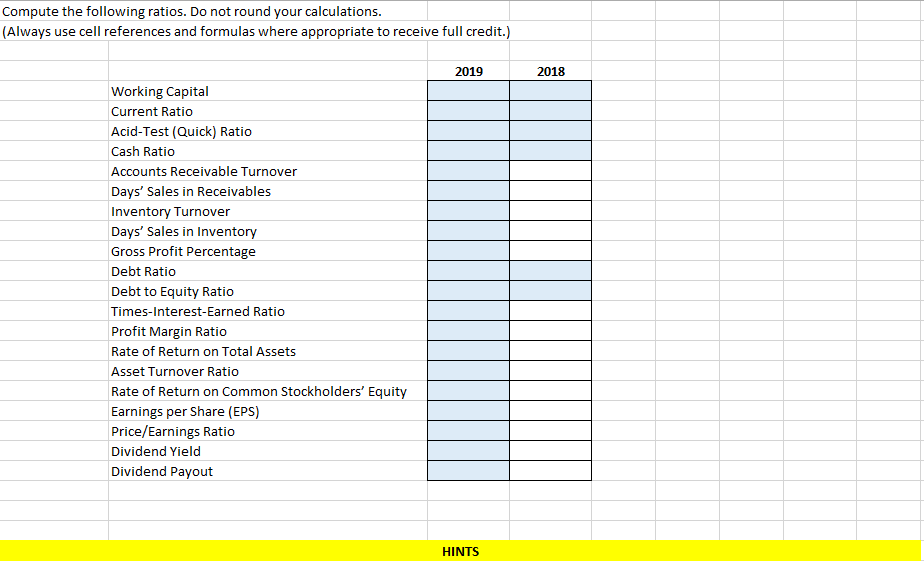
Compute the following ratios. Do not round your calculations. (Always use cell references and formulas where appropriate to receive full credit.) Working Capital Current


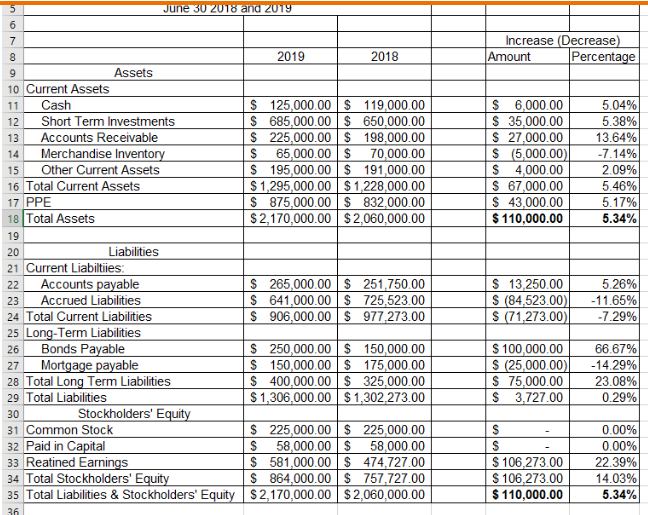
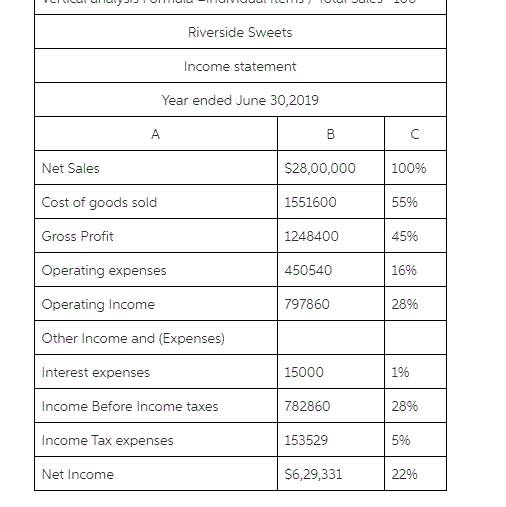
Compute the following ratios. Do not round your calculations. (Always use cell references and formulas where appropriate to receive full credit.) Working Capital Current Ratio Acid-Test (Quick) Ratio Cash Ratio Accounts Receivable Turnover Days' Sales in Receivables Inventory Turnover Days' Sales in Inventory Gross Profit Percentage Debt Ratio Debt to Equity Ratio Times-Interest-Earned Ratio Profit Margin Ratio Rate of Return on Total Assets Asset Turnover Ratio Rate of Return on Common Stockholders' Equity Earnings per Share (EPS) Price/Earnings Ratio Dividend Yield Dividend Payout 2019 HINTS 2018 HINTS Cell | Hint: C5 | Begin the formula with an equals sign (=), use the balance in the horizontal analysis worksheet for your calculations, and press the enter key. C7 | Use the function =SUM( ) to calculate the numerator. C9 | =(0.75*Vertical Analysis'!C8)/(('Horizontal Analysis'!C14+'Horizontal Analysis'!D14)/2) C10 | Assume 365 days in a year and use the correct ratio in this worksheet for your calculations. 5 6 7 8 9 10 Current Assets 11 Assets June 30 2018 and 2019 Cash 12 13 Short Term Investments Accounts Receivable Merchandise Inventory 14 15 Other Current Assets 16 Total Current Assets 17 PPE 18 Total Assets Liabilities 19 20 21 Current Liabiltiies: 22 Accounts payable 23 Accrued Liabilities 24 Total Current Liabilities 25 Long-Term Liabilities Bonds Payable 26 27 Mortgage payable 28 Total Long Term Liabilities 29 Total Liabilities Stockholders' Equity 2019 2018 $ 125,000.00 $ 119,000.00 $ 685,000.00 $ 650,000.00 $ 225,000.00 $ 198,000.00 $ 65,000.00 $ 70,000.00 $ 195,000.00 $ 191,000.00 $1,295,000.00 $1,228,000.00 $ 875,000.00 $ 832,000.00 $2,170,000.00 $2,060,000.00 $ 265,000.00 $ 251,750.00 $ 641,000.00 $ 725,523.00 $ 906,000.00 $ 977,273.00 $ 250,000.00 $ 150,000.00 $ 150,000.00 $ 175,000.00 $ 400,000.00 $ 325,000.00 $1,306,000.00 $1,302,273.00 30 31 Common Stock 32 Paid in Capital 33 Reatined Earnings 34 Total Stockholders' Equity 35 Total Liabilities & Stockholders' Equity $2,170,000.00 36 $ 225,000.00 $ 225,000.00 $ 58,000.00 $ 58,000.00 $ 581,000.00 $ 474,727.00 $ 864,000.00 $ 757,727.00 $2,060,000.00 Increase (Decrease) Amount $ 6,000.00 $ 35,000.00 $ 27,000.00 $ (5,000.00) $ 4,000.00 $ 67,000.00 $ 43,000.00 $ 110,000.00 $ 13,250.00 $ (84,523.00) $ (71,273.00) $ 100,000.00 $ (25,000.00) $ 75,000.00 $ 3,727.00 $ $ 106,273.00 $ 106,273.00 $ 110,000.00 Percentage 5.04% 5.38% 13.64% -7.14% 2.09% 5.46% 5.17% 5.34% 5.26% -11.65% -7.29% 66.67% -14.29% 23.08% 0.29% 0.00% 0.00% 22.39% 14.03% 5.34% Net Sales Cost of goods sold Gross Profit A Net Income Riverside Sweets Income statement Year ended June 30,2019 Operating expenses Operating Income Other Income and (Expenses) Interest expenses Income Before Income taxes Income Tax expenses B $28,00,000 1551600 1248400 450540 797860 15000 782860 153529 $6,29,331 100% 55% 45% 16% 28% 1% 28% 5% 22%
Step by Step Solution
3.49 Rating (162 Votes )
There are 3 Steps involved in it
Step: 1

See step-by-step solutions with expert insights and AI powered tools for academic success
Step: 2

Step: 3

Ace Your Homework with AI
Get the answers you need in no time with our AI-driven, step-by-step assistance
Get Started


