

Question
- Compute the forecast error measures (all three discussed in class) and recommend which forecasting method the manufacturer should go with, based on those measures.
- Compute the forecast error measures (all three discussed in class) and recommend which forecasting method the manufacturer should go with, based on those measures. - Which forecast is better between the two moving averages approaches? Why is this the case (provide explanations other than comparing the error measure values)? -Which forecast is better between the two exponential smoothing approaches? Why is this the case (provide explanations other than comparing the error measure values)? - Which forecasting model better explains and predicts the demand pattern overall? Why is this the case (provide explanations other than comparing the error measure values)? - Think about a couple of years from now (say 2025). Do you think the best forecasting model you obtained here would still be a proper model to use, even if you included the new data from 2021 to say 2024? Why? (hint: the company is established in 2018). What could happen to the pattern of sales over time. Discuss.
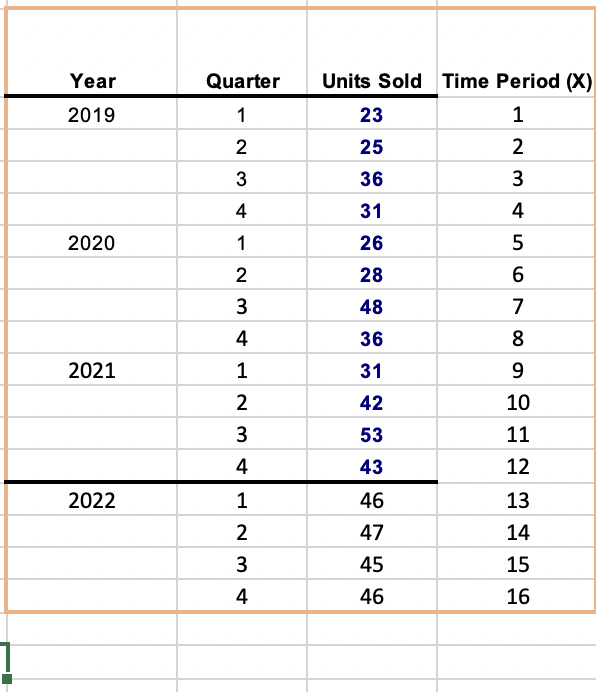
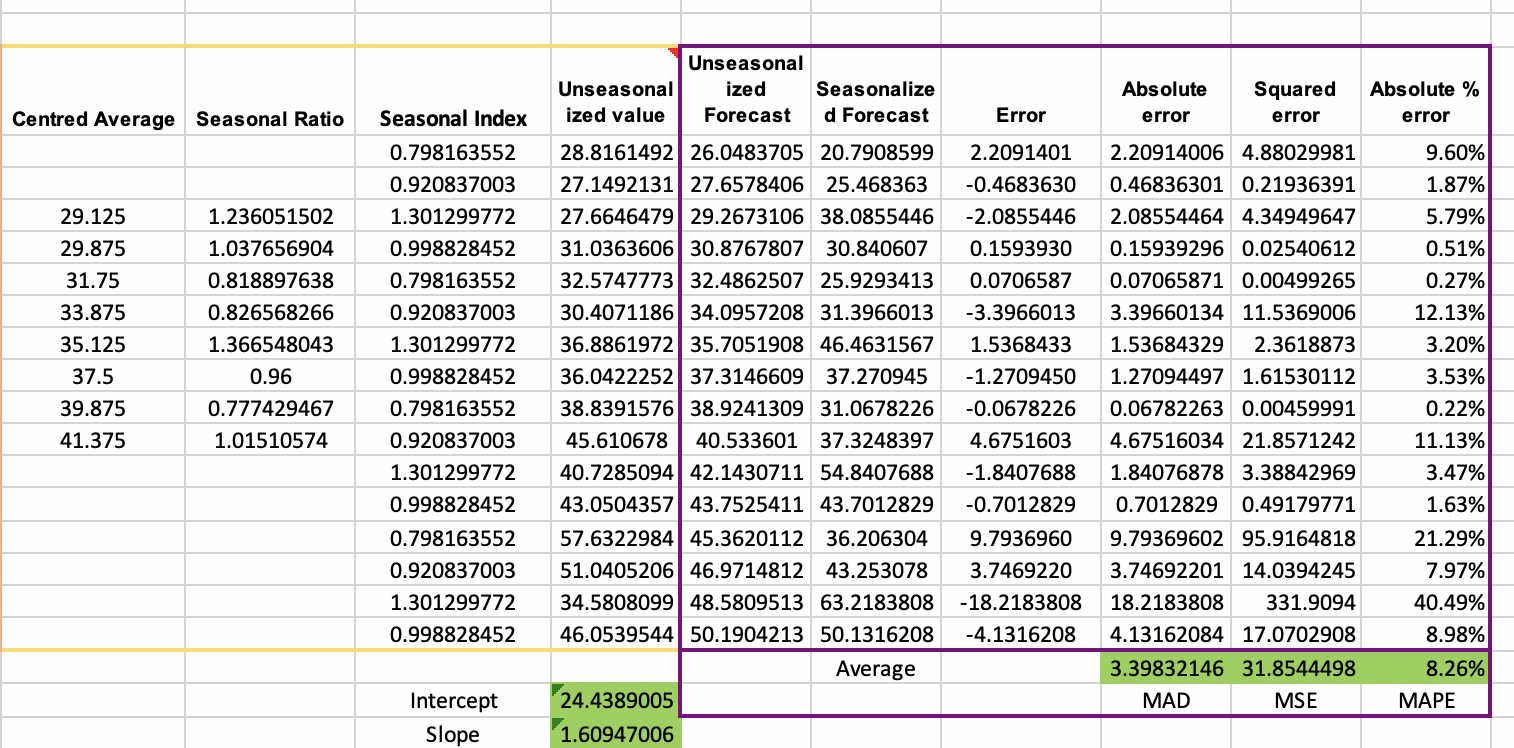
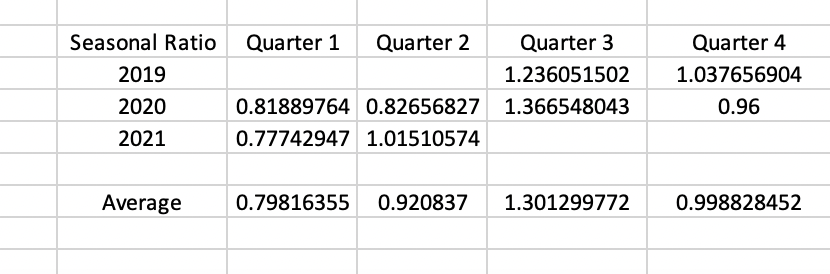
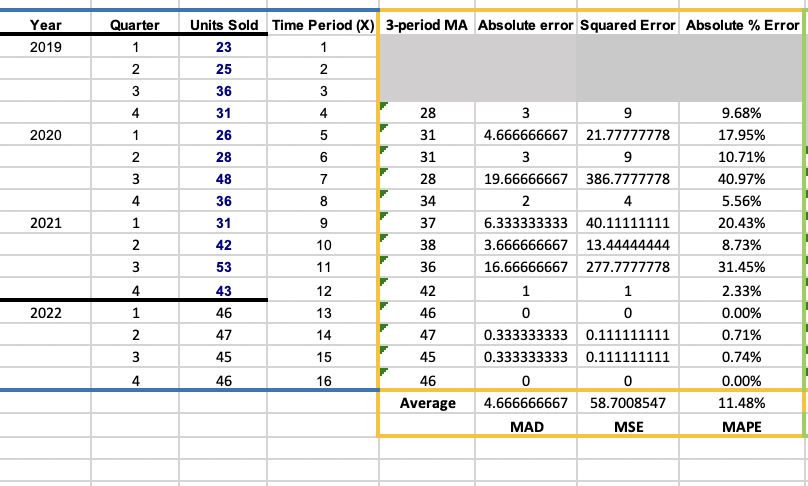
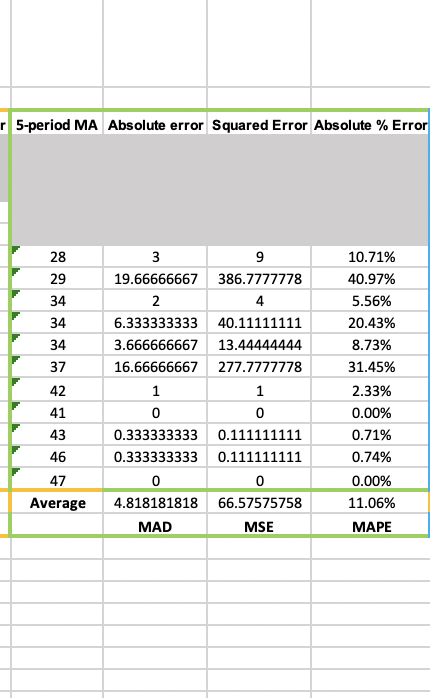
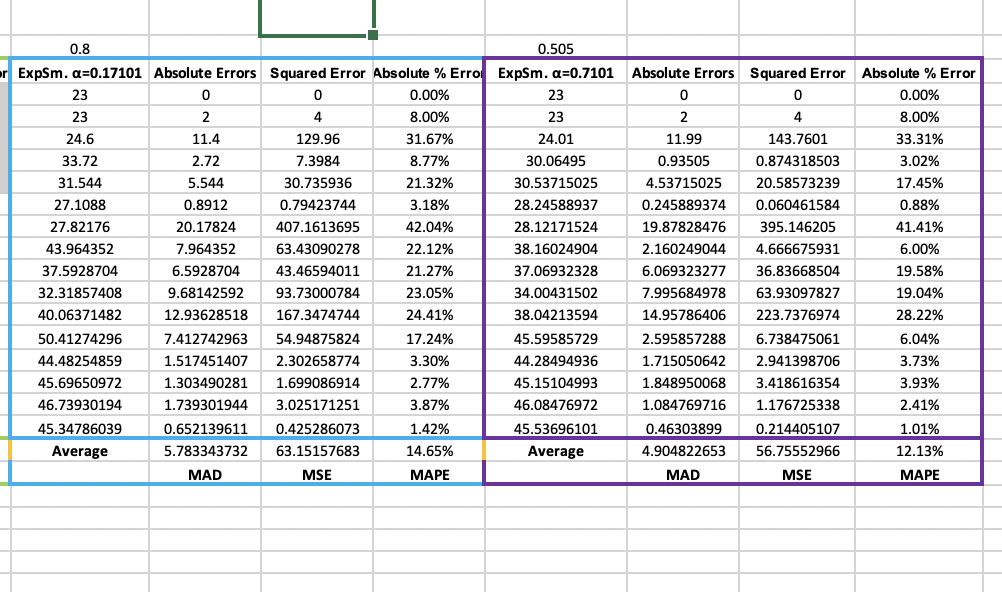
Year 2019 Quarter 1 2 3 4 2020 1 2 3 4 1 Units Sold Time Period (X) 23 1 25 2 36 3 31 4 26 5 28 6 48 7 36 8 31 9 42 10 53 11 43 12 46 13 47 14 45 15 46 16 2021 2 3 4 2022 1 2 Nm 3 4 Unseasonal ized Forecast Unseasonal ized value Absolute Seasonalize d Forecast Squared error Absolute % error Centred Average Seasonal Ratio Error error 29.125 29.875 31.75 33.875 35.125 37.5 39.875 41.375 1.236051502 1.037656904 0.818897638 0.826568266 1.366548043 0.96 0.777429467 1.01510574 Seasonal Index 0.798163552 0.920837003 1.301299772 0.998828452 0.798163552 0.920837003 1.301299772 0.998828452 0.798163552 0.920837003 1.301299772 0.998828452 0.798163552 0.920837003 1.301299772 0.998828452 28.8161492 26.0483705 20.7908599 27.1492131 27.6578406 25.468363 27.664647929.2673106 38.0855446 31.0363606 30.8767807 30.840607 32.574777332.4862507 25.9293413 30.4071186 34.0957208 31.3966013 36.8861972 35.7051908 46.4631567 36.0422252 37.3146609 37.270945 38.8391576 38.9241309 31.0678226 45.610678 40.533601 37.3248397 40.7285094 42.1430711 54.8407688 43.0504357 43.7525411 43.7012829 57.6322984 45.3620112 36.206304 51.0405206 46.9714812 43.253078 34.5808099 48.5809513 63.2183808 46.0539544 50.1904213 50.1316208 Average 24.4389005 1.60947006 2.2091401 -0.4683630 -2.0855446 0.1593930 0.0706587 -3.3966013 1.5368433 -1.2709450 -0.0678226 4.6751603 -1.8407688 -0.7012829 9.7936960 3.7469220 -18.2183808 -4.1316208 2.20914006 4.88029981 0.46836301 0.21936391 2.08554464 4.34949647 0.15939296 0.02540612 0.07065871 0.00499265 3.39660134 11.5369006 1.53684329 2.3618873 1.27094497 1.61530112 0.06782263 0.00459991 4.67516034 21.8571242 1.84076878 3.38842969 0.7012829 0.49179771 9.79369602 95.9164818 3.74692201 14.0394245 18.2183808 331.9094 4.13162084 17.0702908 3.39832146 31.8544498 MAD MSE 9.60% 1.87% 5.79% 0.51% 0.27% 12.13% 3.20% 3.53% 0.22% 11.13% 3.47% 1.63% 21.29% 7.97% 40.49% 8.98% 8.26% MAPE Intercept Slope Seasonal Ratio 2019 2020 2021 Quarter 1 Quarter 2 Quarter 3 1.236051502 0.81889764 0.82656827 1.366548043 0.77742947 1.01510574 Quarter 4 1.037656904 0.96 Average 0.79816355 0.920837 1.301299772 0.998828452 Year 2019 Quarter 1 2 3 28 2020 4 1 2 3 4 1 2 3 2021 Units Sold Time Period (x) 3-period MA Absolute error Squared Error Absolute % Error 23 1 25 2 36 3 31 4 3 9 9.68% 26 5 31 4.666666667 21.77777778 17.95% 28 6 31 3 9 10.71% 48 7 28 19.66666667 386.7777778 40.97% 36 8 34 2 4 5.56% 31 9 37 6.333333333 40.11111111 20.43% 42 10 38 3.666666667 13.44444444 8.73% 53 11 36 16.66666667 277.7777778 31.45% 43 12 42 1 1 2.33% 46 13 46 0 0 0.00% 47 14 47 0.333333333 0.111111111 0.71% 45 15 45 0.333333333 0.111111111 0.74% 46 16 46 0 0 0.00% Average 4.666666667 58.7008547 11.48% MAD MSE MAPE 4 w N w NPA 2022 1 2 4 r 5-period MA Absolute error Squared Error Absolute % Error 28 29 34 34 34 37 42 41 43 46 47 Average 3 9 19.66666667 386.7777778 2 4 6.333333333 40.11111111 3.666666667 13.44444444 16.66666667 277.7777778 1 1 o 0 0.333333333 0.111111111 0.333333333 0.111111111 0 0 4.818181818 66.57575758 MAD MSE 10.71% 40.97% 5.56% 20.43% 8.73% 31.45% 2.33% 0.00% 0.71% 0.74% 0.00% 11.06% MAPE 0.8 0.505 r ExpSm. a=0.17101 Absolute Errors Squared Error Absolute % Error ExpSm. a=0.7101 23 0 0 0.00% 23 23 2 4 8.00% 23 24.6 11.4 129.96 31.67% 24.01 33.72 2.72 7.3984 8.77% 30.06495 31.544 5.544 30.735936 21.32% 30.53715025 27.1088 0.8912 0.79423744 3.18% 28.24588937 27.82176 20.17824 407.1613695 42.04% 28.12171524 43.964352 7.964352 63.43090278 22.12% 38.16024904 37.5928704 6.5928704 43.46594011 21.27% 37.06932328 32.31857408 9.68142592 93.73000784 23.05% 34.00431502 40.06371482 12.93628518 167.3474744 24.41% 38.04213594 50.41274296 7.412742963 54.94875824 17.24% 45.59585729 44.48254859 1.517451407 2.302658774 3.30% 44.28494936 45.69650972 1.303490281 1.699086914 2.77% 45.15104993 46.73930194 1.739301944 3.025171251 3.87% 46.08476972 45.34786039 0.652139611 0.425286073 1.42% 45.53696101 Average 5.783343732 63.15157683 14.65% Average MAD MSE MAPE Absolute Errors Squared Error Absolute % Error 0 0 0.00% 2 4 8.00% 11.99 143.7601 33.31% 0.93505 0.874318503 3.02% 4.53715025 20.58573239 17.45% 0.245889374 0.060461584 0.88% 19.87828476 395.146205 41.41% 2.160249044 4.666675931 6.00% 6.069323277 36.83668504 19.58% 7.995684978 63.93097827 19.04% 14.95786406 223.7376974 28.22% 2.595857288 6.738475061 6.04% 1.715050642 2.941398706 3.73% 1.848950068 3.418616354 3.93% 1.084769716 1.176725338 2.41% 0.46303899 0.214405107 1.01% 4.904822653 56.75552966 12.13% MAD MSE MAPE SPOT Year 2019 Quarter 1 2 3 4 2020 1 2 3 4 1 Units Sold Time Period (X) 23 1 25 2 36 3 31 4 26 5 28 6 48 7 36 8 31 9 42 10 53 11 43 12 46 13 47 14 45 15 46 16 2021 2 3 4 2022 1 2 Nm 3 4 Unseasonal ized Forecast Unseasonal ized value Absolute Seasonalize d Forecast Squared error Absolute % error Centred Average Seasonal Ratio Error error 29.125 29.875 31.75 33.875 35.125 37.5 39.875 41.375 1.236051502 1.037656904 0.818897638 0.826568266 1.366548043 0.96 0.777429467 1.01510574 Seasonal Index 0.798163552 0.920837003 1.301299772 0.998828452 0.798163552 0.920837003 1.301299772 0.998828452 0.798163552 0.920837003 1.301299772 0.998828452 0.798163552 0.920837003 1.301299772 0.998828452 28.8161492 26.0483705 20.7908599 27.1492131 27.6578406 25.468363 27.664647929.2673106 38.0855446 31.0363606 30.8767807 30.840607 32.574777332.4862507 25.9293413 30.4071186 34.0957208 31.3966013 36.8861972 35.7051908 46.4631567 36.0422252 37.3146609 37.270945 38.8391576 38.9241309 31.0678226 45.610678 40.533601 37.3248397 40.7285094 42.1430711 54.8407688 43.0504357 43.7525411 43.7012829 57.6322984 45.3620112 36.206304 51.0405206 46.9714812 43.253078 34.5808099 48.5809513 63.2183808 46.0539544 50.1904213 50.1316208 Average 24.4389005 1.60947006 2.2091401 -0.4683630 -2.0855446 0.1593930 0.0706587 -3.3966013 1.5368433 -1.2709450 -0.0678226 4.6751603 -1.8407688 -0.7012829 9.7936960 3.7469220 -18.2183808 -4.1316208 2.20914006 4.88029981 0.46836301 0.21936391 2.08554464 4.34949647 0.15939296 0.02540612 0.07065871 0.00499265 3.39660134 11.5369006 1.53684329 2.3618873 1.27094497 1.61530112 0.06782263 0.00459991 4.67516034 21.8571242 1.84076878 3.38842969 0.7012829 0.49179771 9.79369602 95.9164818 3.74692201 14.0394245 18.2183808 331.9094 4.13162084 17.0702908 3.39832146 31.8544498 MAD MSE 9.60% 1.87% 5.79% 0.51% 0.27% 12.13% 3.20% 3.53% 0.22% 11.13% 3.47% 1.63% 21.29% 7.97% 40.49% 8.98% 8.26% MAPE Intercept Slope Seasonal Ratio 2019 2020 2021 Quarter 1 Quarter 2 Quarter 3 1.236051502 0.81889764 0.82656827 1.366548043 0.77742947 1.01510574 Quarter 4 1.037656904 0.96 Average 0.79816355 0.920837 1.301299772 0.998828452 Year 2019 Quarter 1 2 3 28 2020 4 1 2 3 4 1 2 3 2021 Units Sold Time Period (x) 3-period MA Absolute error Squared Error Absolute % Error 23 1 25 2 36 3 31 4 3 9 9.68% 26 5 31 4.666666667 21.77777778 17.95% 28 6 31 3 9 10.71% 48 7 28 19.66666667 386.7777778 40.97% 36 8 34 2 4 5.56% 31 9 37 6.333333333 40.11111111 20.43% 42 10 38 3.666666667 13.44444444 8.73% 53 11 36 16.66666667 277.7777778 31.45% 43 12 42 1 1 2.33% 46 13 46 0 0 0.00% 47 14 47 0.333333333 0.111111111 0.71% 45 15 45 0.333333333 0.111111111 0.74% 46 16 46 0 0 0.00% Average 4.666666667 58.7008547 11.48% MAD MSE MAPE 4 w N w NPA 2022 1 2 4 r 5-period MA Absolute error Squared Error Absolute % Error 28 29 34 34 34 37 42 41 43 46 47 Average 3 9 19.66666667 386.7777778 2 4 6.333333333 40.11111111 3.666666667 13.44444444 16.66666667 277.7777778 1 1 o 0 0.333333333 0.111111111 0.333333333 0.111111111 0 0 4.818181818 66.57575758 MAD MSE 10.71% 40.97% 5.56% 20.43% 8.73% 31.45% 2.33% 0.00% 0.71% 0.74% 0.00% 11.06% MAPE 0.8 0.505 r ExpSm. a=0.17101 Absolute Errors Squared Error Absolute % Error ExpSm. a=0.7101 23 0 0 0.00% 23 23 2 4 8.00% 23 24.6 11.4 129.96 31.67% 24.01 33.72 2.72 7.3984 8.77% 30.06495 31.544 5.544 30.735936 21.32% 30.53715025 27.1088 0.8912 0.79423744 3.18% 28.24588937 27.82176 20.17824 407.1613695 42.04% 28.12171524 43.964352 7.964352 63.43090278 22.12% 38.16024904 37.5928704 6.5928704 43.46594011 21.27% 37.06932328 32.31857408 9.68142592 93.73000784 23.05% 34.00431502 40.06371482 12.93628518 167.3474744 24.41% 38.04213594 50.41274296 7.412742963 54.94875824 17.24% 45.59585729 44.48254859 1.517451407 2.302658774 3.30% 44.28494936 45.69650972 1.303490281 1.699086914 2.77% 45.15104993 46.73930194 1.739301944 3.025171251 3.87% 46.08476972 45.34786039 0.652139611 0.425286073 1.42% 45.53696101 Average 5.783343732 63.15157683 14.65% Average MAD MSE MAPE Absolute Errors Squared Error Absolute % Error 0 0 0.00% 2 4 8.00% 11.99 143.7601 33.31% 0.93505 0.874318503 3.02% 4.53715025 20.58573239 17.45% 0.245889374 0.060461584 0.88% 19.87828476 395.146205 41.41% 2.160249044 4.666675931 6.00% 6.069323277 36.83668504 19.58% 7.995684978 63.93097827 19.04% 14.95786406 223.7376974 28.22% 2.595857288 6.738475061 6.04% 1.715050642 2.941398706 3.73% 1.848950068 3.418616354 3.93% 1.084769716 1.176725338 2.41% 0.46303899 0.214405107 1.01% 4.904822653 56.75552966 12.13% MAD MSE MAPE SPOTStep by Step Solution
There are 3 Steps involved in it
Step: 1

Get Instant Access to Expert-Tailored Solutions
See step-by-step solutions with expert insights and AI powered tools for academic success
Step: 2

Step: 3
Ace Your Homework with AI
Get the answers you need in no time with our AI-driven, step-by-step assistance
Get Started
Public Finance In A Changing World
Authors: Peter Birch Sorensen
1998th Edition
0333682211, 978-0333682210