Answered step by step
Verified Expert Solution
Link Copied!

Question

1 Approved Answer

compute UPS cumulative annual return from 2012 to 2015 Casc 2 The Battle for Valuc, 2016: FedEx Corp. versus United Parcel Service, Inc 39 EXHIBIT

compute UPS cumulative annual return from 2012 to 2015 image text in transcribed
Casc 2 The Battle for Valuc, 2016: FedEx Corp. versus United Parcel Service, Inc 39 EXHIBIT 2.51 Financial and Market Performance FedEx 2012 2013 2014 2015 Stock Price, Dec. 31 Close Dividends Declared in $ Per Share Basic EPS (period ending May 31) Common Shares Outstanding (Mill) Price/Earnings Annual Return Cumul. Annual Return 91.72 0.52 6,44 317.0 14.7 143.77 0.56 8.61 318.0 27.8 57.4% 57.4% 173.66 0.6 7.56 287.0 22.0 21.2% 78.6% 148.99 0. 3.7 282.4 37.9 -13.7% 64.8% UPS 2012 2013 2014 2015 Stock Price, Dec. 31 Close Dividends Declared in $ Per Share Basic EPS Common Shares Outstanding (MITI) Price/Earnings Annual Return Cumul. Annual Return 73.73 2.28 0.84 953.0 88.5 105.08 2.48 4.65 924.0 67.1 45.9% 45.9% 111.17 2.68 3.31 905.0 27.6 8.3% 54.2% 96.23 2.92 5.38 886.0 22.0 -10.8% 43.4% Standard & Poor's 500 Index 2012 2013 2014 2015 1.426.19 Index Level, Dec. 31 Close Annual Return Cumul. Annual Return 1.848.36 29.6% 29.6% 2,058.90 11.4% 41.0% 2,043.94 -0.7% 40.3% Data source: Google Finance, Morningstar, Value Line, and Capital Casc 2 The Battle for Valuc, 2016: FedEx Corp. versus United Parcel Service, Inc 39 EXHIBIT 2.51 Financial and Market Performance FedEx 2012 2013 2014 2015 Stock Price, Dec. 31 Close Dividends Declared in $ Per Share Basic EPS (period ending May 31) Common Shares Outstanding (Mill) Price/Earnings Annual Return Cumul. Annual Return 91.72 0.52 6,44 317.0 14.7 143.77 0.56 8.61 318.0 27.8 57.4% 57.4% 173.66 0.6 7.56 287.0 22.0 21.2% 78.6% 148.99 0. 3.7 282.4 37.9 -13.7% 64.8% UPS 2012 2013 2014 2015 Stock Price, Dec. 31 Close Dividends Declared in $ Per Share Basic EPS Common Shares Outstanding (MITI) Price/Earnings Annual Return Cumul. Annual Return 73.73 2.28 0.84 953.0 88.5 105.08 2.48 4.65 924.0 67.1 45.9% 45.9% 111.17 2.68 3.31 905.0 27.6 8.3% 54.2% 96.23 2.92 5.38 886.0 22.0 -10.8% 43.4% Standard & Poor's 500 Index 2012 2013 2014 2015 1.426.19 Index Level, Dec. 31 Close Annual Return Cumul. Annual Return 1.848.36 29.6% 29.6% 2,058.90 11.4% 41.0% 2,043.94 -0.7% 40.3% Data source: Google Finance, Morningstar, Value Line, and Capital

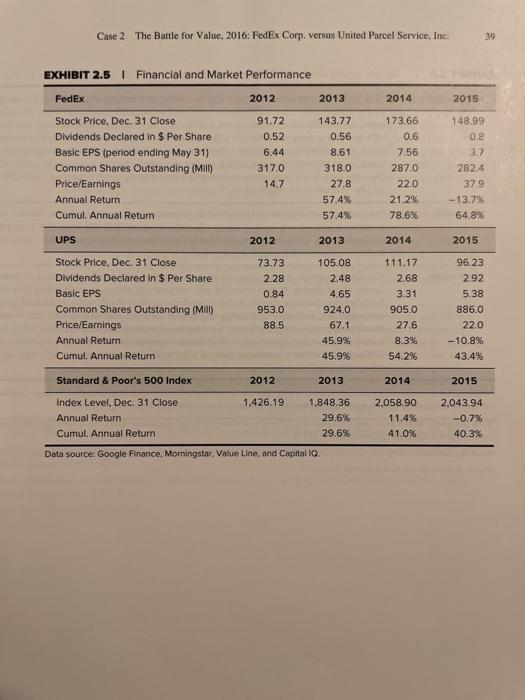
Step by Step Solution

There are 3 Steps involved in it

Step: 1

blur-text-image

Get Instant Access to Expert-Tailored Solutions

See step-by-step solutions with expert insights and AI powered tools for academic success

Step: 2

blur-text-image

Step: 3

blur-text-image

Ace Your Homework with AI

Get the answers you need in no time with our AI-driven, step-by-step assistance

Get Started

Students also viewed these Finance questions

Question

=+3. Describe optimal treatment for transgender youth.

Answered: 1 week ago