

Answered step by step
Verified Expert Solution
Question
1 Approved Answer
Computing Ratios and Comparing Alternative Investment Opportunities (AP13-4) 3-4 3-5, The current year financial statements for Blue Water Company and Prime Fish Company are presented
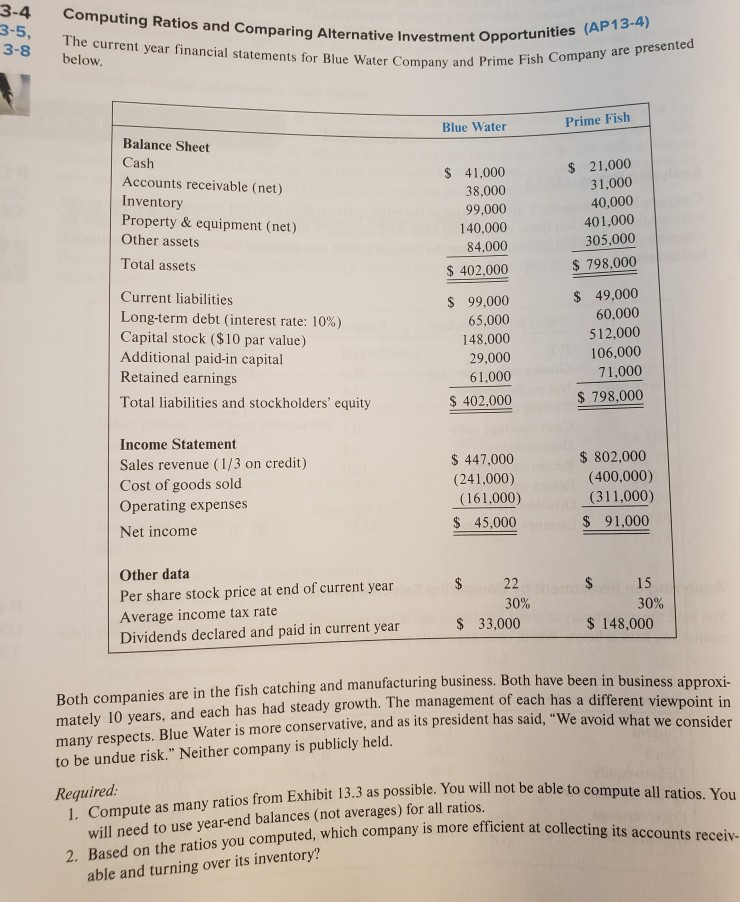
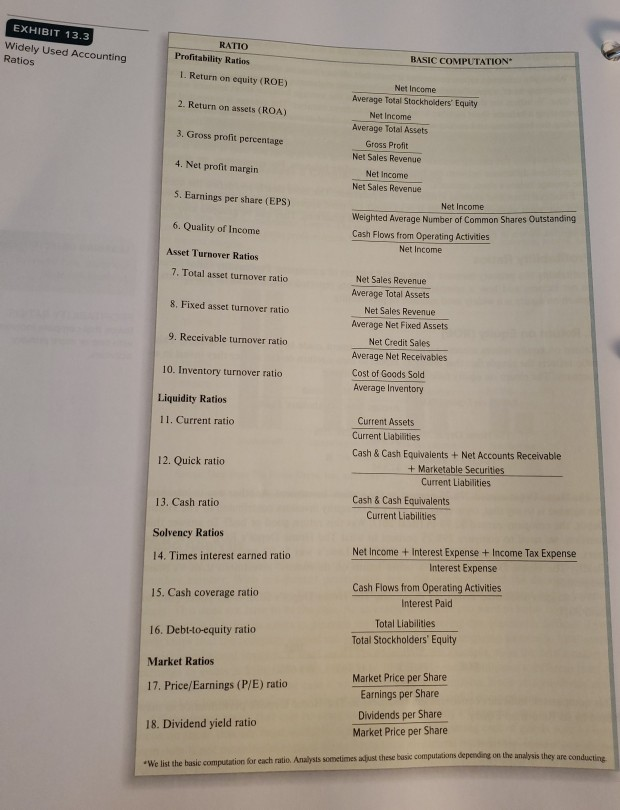
Computing Ratios and Comparing Alternative Investment Opportunities (AP13-4) 3-4 3-5, The current year financial statements for Blue Water Company and Prime Fish Company are presented 3-8 below. Prime Fish Blue Water Balance Sheet $ 21,000 31,000 40,000 Cash 41,000 Accounts receivable (net) 38,000 Inventory Property & equipment (net) Other assets 99,000 140,000 401,000 305,000 84,000 Total assets 798,000 $ 402,000 $ 49,000 60,000 512,000 Current liabilities $ 99,000 Long-term debt (interest rate: 10 %) Capital stock ($10 par value) Additional paid-in capital Retained earnings 65,000 148,000 106,000 71,000 29,000 61,000 $ 798,000 $ 402,000 Total liabilities and stockholders' equity Income Statement $ 802,000 (400,000) (311,000) 447,000 Sales revenue (1/3 on credit) (241,000) Cost of goods sold Operating expenses (161,000) 45,000 $91,000 Net income Other data $ 15 22 Per share stock price at end of current year 30% 30% Average income tax rate Dividends declared and paid in current year $ 148,000 $33,000 Both companies are in the fish catching and manufacturing business. Both have been in business approxi- mately 10 years, and each has had steady growth. The management of each has a different viewpoint in many respects. Blue Water is more conservative, and as its president has said, "We avoid what we consider to be undue risk." Neither company is publicly held. Required 1. Compute will need to use year-end balances (not averages) for all ratios as many ratios from Exhibit 13.3 as possible. You will not be able to compute all ratios. You 2. Based on the ratios you computed, which company is more efficient at collecting its accounts receiv- able and turning over its inventory? EXHIBIT 13.3 RATIO Widely Used Accounting BASIC COMPUTATION Profitability Ratios Ratios I. Return on equity (ROE) Net Income Average Total Stackholders' Equity 2. Return on assets (ROA) Net Income Average Total Assets 3. Gross profit percentage Gross Profit Net Sales Revenue 4. Net profit margin Net Income Net Sales Revenue 5. Earnings per share (EPS) Net Income Weighted Average Number of Common Shares Outstanding 6. Quality of Income Cash Flows from Operating Activities Net Income Asset Turnover Ratios 7. Total asset turnover ratio Net Sales Revenue Average Total Assets 8. Fixed asset turnover ratio Net Sales Revenue Average Net Fixed Assets 9. Receivable turnover ratio Net Credit Sales Average Net Receivables Cost of Goods Sold 10. Inventory turnover ratio Average Inventory Liquidity Ratios Current Assets 11. Current ratio Current Liabilities Cash & Cash Equivalents + Net Accounts Receivable 12. Quick ratio + Marketable Securities Current Liabilities Cash& Cash Equivalents 13. Cash ratio Current Liabilities Solvency Ratios Net Income + Interest Expense + Income Tax Expense Interest Expense 14. Times interest earned ratio Cash Flows from Operating Activities 15. Cash coverage ratio Interest Paid Total Liabilities 16. Debt-to-equity ratio Total Stockholders' Equity Market Ratios Market Price per Share 17. Price/Earnings (P/E) ratio Earnings per Share Dividends per Share 18. Dividend yield ratio Market Price per Share We list the basic computation for each ratio. Analysts sometimes adust these basic computations depending on the analysis they are conducting
Step by Step Solution
There are 3 Steps involved in it
Step: 1

Get Instant Access to Expert-Tailored Solutions
See step-by-step solutions with expert insights and AI powered tools for academic success
Step: 2

Step: 3
Ace Your Homework with AI
Get the answers you need in no time with our AI-driven, step-by-step assistance
Get Started
Measurement And Internal Audit Operations
Authors: Andrew Fight
1st Edition
184112401X, 978-1841124018