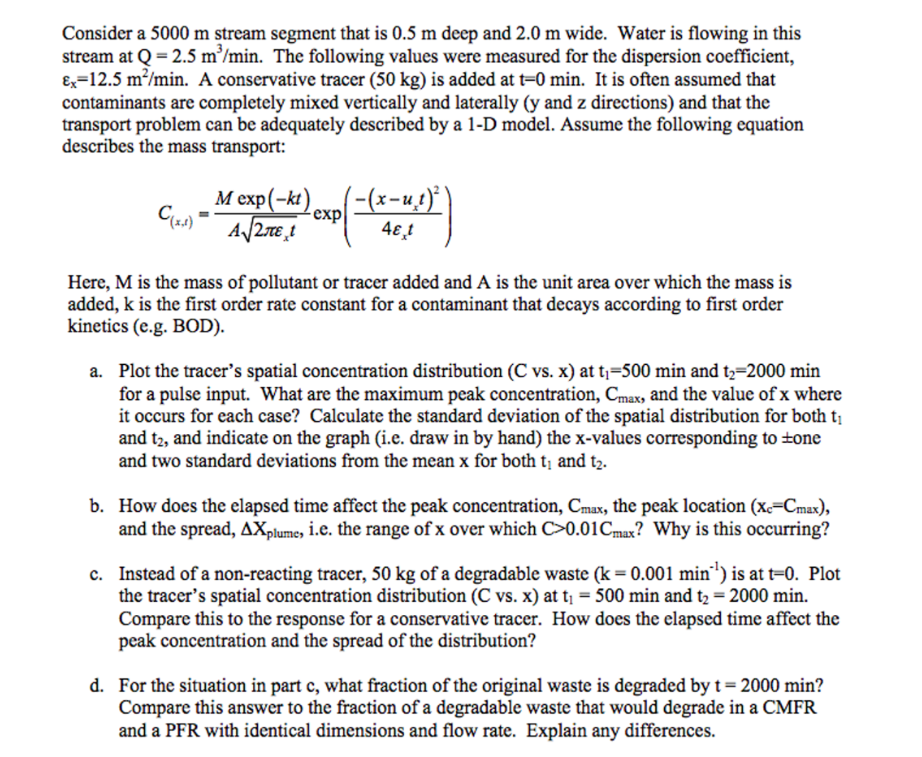
Consider a 5000 m stream segment that is 0.5 m deep and 2.0 m wide. Water is flowing in this stream at Q= 2.5 m/min. The following values were measured for the dispersion coefficient, Ex=12.5 m/min. A conservative tracer (50 kg) is added at t=0 min. It is often assumed that contaminants are completely mixed vertically and laterally (y and z directions) and that the transport problem can be adequately described by a 1-D model. Assume the following equation describes the mass transport: C-1) M exp(-kt) exp A/2.181 -(x-u,t) 4t Here, M is the mass of pollutant or tracer added and A is the unit area over which the mass is added, k is the first order rate constant for a contaminant that decays according to first order kinetics (e.g. BOD). a. Plot the tracer's spatial concentration distribution (C vs. x) at t;=500 min and tz=2000 min for a pulse input. What are the maximum peak concentration, Cmax, and the value of x where it occurs for each case? Calculate the standard deviation of the spatial distribution for both t; and t2, and indicate on the graph (i.e. draw in by hand) the x-values corresponding to tone and two standard deviations from the mean x for both t; and t2. b. How does the elapsed time affect the peak concentration, Cmax, the peak location (xc=Cmax), and the spread, AXplume, i.e. the range of x over which >0.01Cmax? Why is this occurring? c. Instead of a non-reacting tracer, 50 kg of a degradable waste (k = 0.001 min') is at t=0. Plot the tracer's spatial concentration distribution (C vs. x) at t1 = 500 min and t2 = 2000 min. Compare this to the response for a conservative tracer. How does the elapsed time affect the peak concentration and the spread of the distribution? d. For the situation in part c, what fraction of the original waste is degraded by t= 2000 min? Compare this answer to the fraction of a degradable waste that would degrade in a CMFR and a PFR with identical dimensions and flow rate. Explain any differences. Consider a 5000 m stream segment that is 0.5 m deep and 2.0 m wide. Water is flowing in this stream at Q= 2.5 m/min. The following values were measured for the dispersion coefficient, Ex=12.5 m/min. A conservative tracer (50 kg) is added at t=0 min. It is often assumed that contaminants are completely mixed vertically and laterally (y and z directions) and that the transport problem can be adequately described by a 1-D model. Assume the following equation describes the mass transport: C-1) M exp(-kt) exp A/2.181 -(x-u,t) 4t Here, M is the mass of pollutant or tracer added and A is the unit area over which the mass is added, k is the first order rate constant for a contaminant that decays according to first order kinetics (e.g. BOD). a. Plot the tracer's spatial concentration distribution (C vs. x) at t;=500 min and tz=2000 min for a pulse input. What are the maximum peak concentration, Cmax, and the value of x where it occurs for each case? Calculate the standard deviation of the spatial distribution for both t; and t2, and indicate on the graph (i.e. draw in by hand) the x-values corresponding to tone and two standard deviations from the mean x for both t; and t2. b. How does the elapsed time affect the peak concentration, Cmax, the peak location (xc=Cmax), and the spread, AXplume, i.e. the range of x over which >0.01Cmax? Why is this occurring? c. Instead of a non-reacting tracer, 50 kg of a degradable waste (k = 0.001 min') is at t=0. Plot the tracer's spatial concentration distribution (C vs. x) at t1 = 500 min and t2 = 2000 min. Compare this to the response for a conservative tracer. How does the elapsed time affect the peak concentration and the spread of the distribution? d. For the situation in part c, what fraction of the original waste is degraded by t= 2000 min? Compare this answer to the fraction of a degradable waste that would degrade in a CMFR and a PFR with identical dimensions and flow rate. Explain any differences


