Question
Consider a data set of the amount of liquid dispensed into juice containers by an automated deepening machine. The data will be used to determine
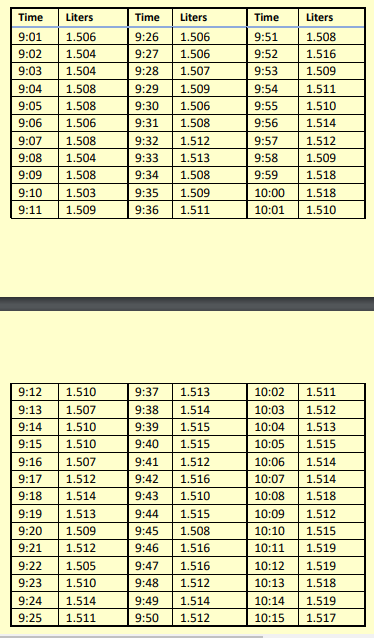
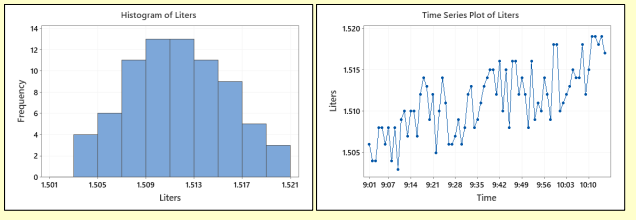
Consider a data set of the amount of liquid dispensed into juice containers by an automated deepening machine. The data will be used to determine the expected performance of the dispensing process. For this product, the specifications are 1.48 to 1.53 liters. An inexperienced analyst provides you with the following information that is factually accurate, but may not be analyzed in an effective or useful way. The data, histogram, and run chart, are shown below. For this data set, the average is 1.5115 liters and the standard deviation is 0.0043 liters. Based on this information, using whatever approach you deem appropriate, how would you evaluate the process performance?


Step by Step Solution
There are 3 Steps involved in it
Step: 1

Get Instant Access to Expert-Tailored Solutions
See step-by-step solutions with expert insights and AI powered tools for academic success
Step: 2

Step: 3

Ace Your Homework with AI
Get the answers you need in no time with our AI-driven, step-by-step assistance
Get Started


