Answered step by step
Verified Expert Solution
Question
1 Approved Answer
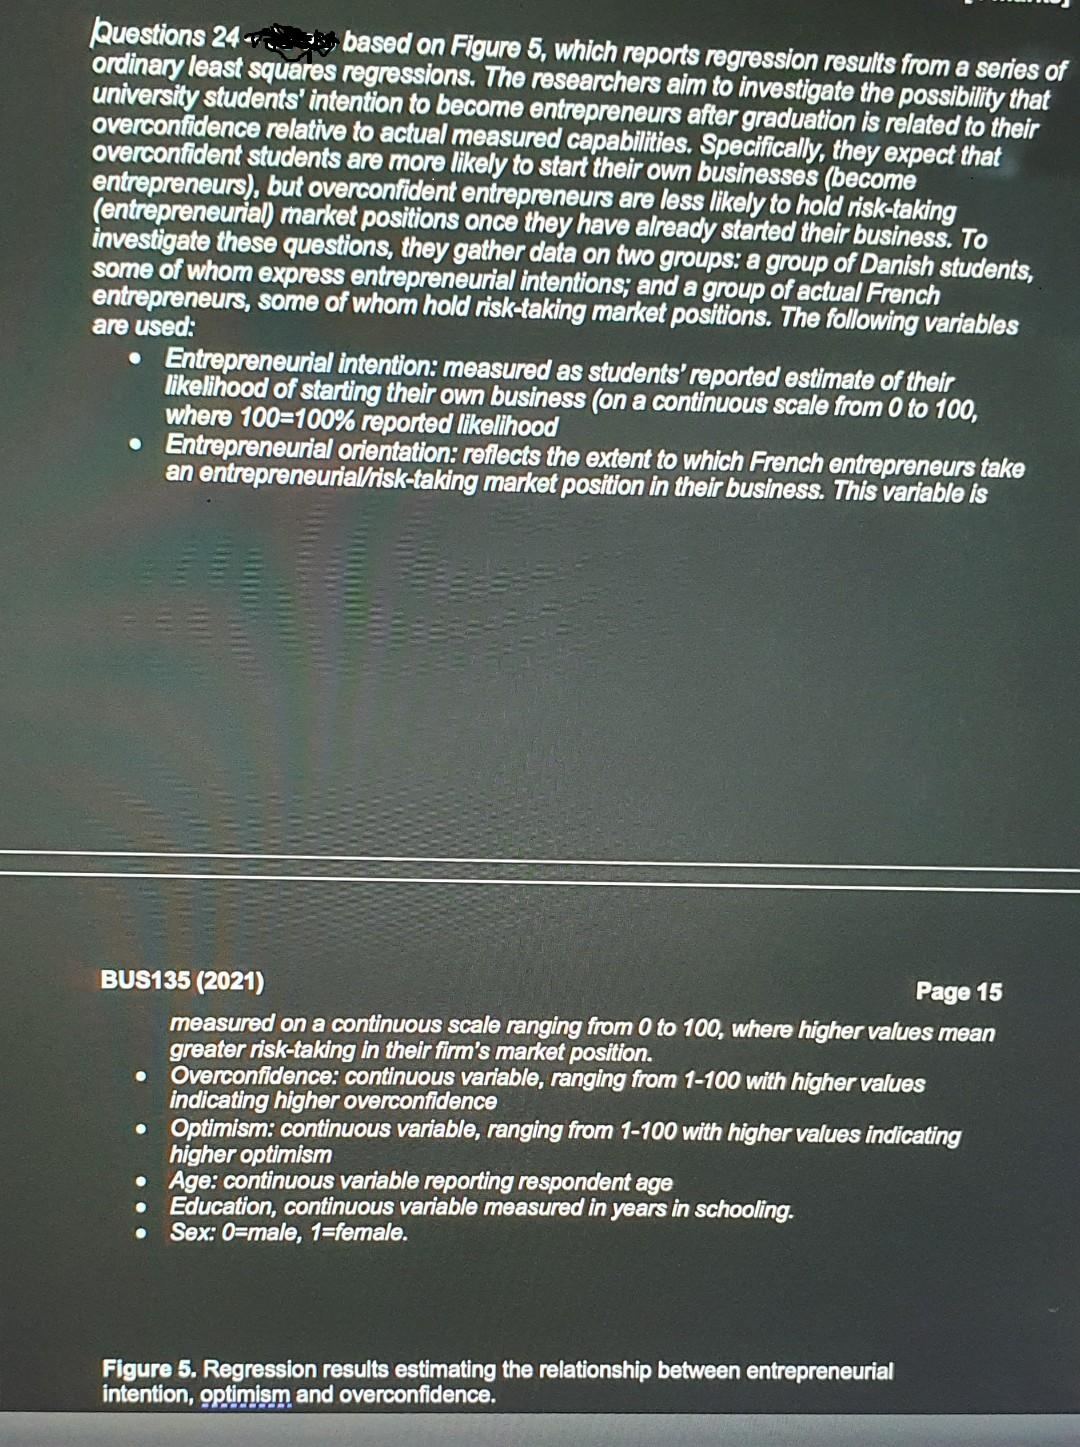
Questions 24 based on Figure 5, which reports regression results from a series of ordinary least squares regressions. The researchers aim to investigate the


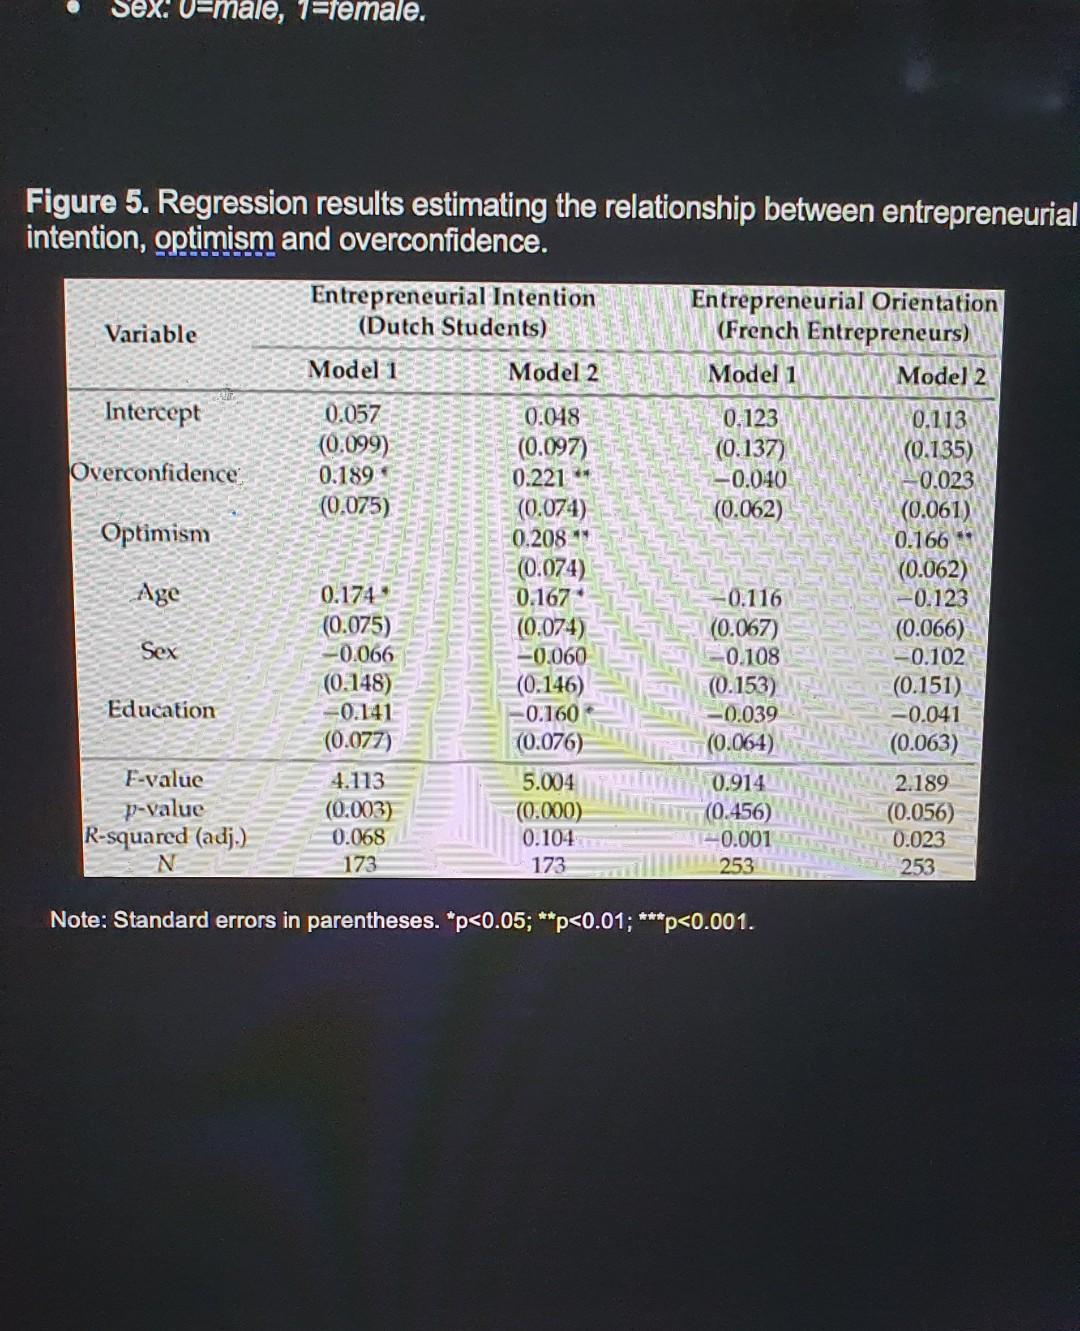
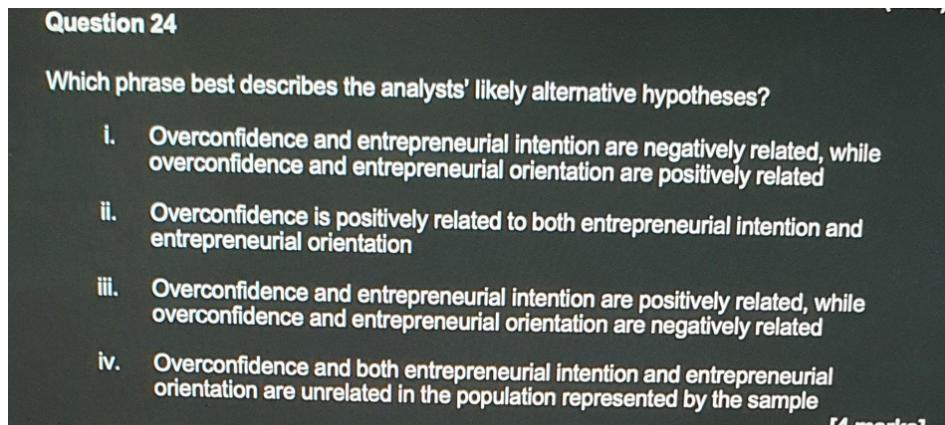
Questions 24 based on Figure 5, which reports regression results from a series of ordinary least squares regressions. The researchers aim to investigate the possibility that university students' intention to become entrepreneurs after graduation is related to their overconfidence relative to actual measured capabilities. Specifically, they expect that overconfident students are more likely to start their own businesses (become entrepreneurs), but overconfident entrepreneurs are less likely to hold risk-taking (entrepreneurial) market positions once they have already started their business. To investigate these questions, they gather data on two groups: a group of Danish students, some of whom express entrepreneurial intentions; and a group of actual French entrepreneurs, some of whom hold risk-taking market positions. The following variables are used: Entrepreneurial intention: measured as students' reported estimate of their likelihood of starting their own business (on a continuous scale from 0 to 100, where 100-100% reported likelihood Entrepreneurial orientation: reflects the extent to which French entrepreneurs take an entrepreneurial/risk-taking market position in their business. This variable is BUS135 (2021) Page 15 measured on a continuous scale ranging from 0 to 100, where higher values mean greater risk-taking in their firm's market position. Overconfidence: continuous variable, ranging from 1-100 with higher values indicating higher overconfidence Optimism: continuous variable, ranging from 1-100 with higher values indicating higher optimism Age: continuous variable reporting respondent age Education, continuous variable measured in years in schooling. Sex: 0=male, 1-female. Figure 5. Regression results estimating the relationship between entrepreneurial intention, optimism and overconfidence. Sex: 0-male, 1-female. Figure 5. Regression results estimating the relationship between entrepreneurial intention, optimism and overconfidence. Variable Intercept Overconfidence Optimism Age Sex Education F-value p-value R-squared (adj.) N Entrepreneurial Intention (Dutch Students) Model 1 0.057 (0.099) 0.189 (0.075) 0.174 (0.075) -0.066 (0.148) -0.141 (0.077) 4.113 (0.003) 0.068 173 Model 2 0.048 (0.097) 0.221** (0.074) 0.208 ** (0.074) 0.167 (0.074) -0.060 (0.146) -0.160 (0.076) 5.004 (0.000) 0.104 173 Entrepreneurial Orientation (French Entrepreneurs) Model 1 0.123 (0.137) -0.040 (0.062) -0.116 (0.067) -0.108 (0.153) -0.039 (0.064) 0.914 (0.456) -0.001 253 Note: Standard errors in parentheses. *p
Step by Step Solution
★★★★★
3.49 Rating (146 Votes )
There are 3 Steps involved in it
Step: 1
i Overconfidence ...
Get Instant Access to Expert-Tailored Solutions
See step-by-step solutions with expert insights and AI powered tools for academic success
Step: 2

Step: 3

Ace Your Homework with AI
Get the answers you need in no time with our AI-driven, step-by-step assistance
Get Started


