Consider a population with a mean / = 250 and standard deviation o = 79. Suppose random samples of size n = 79 are selected
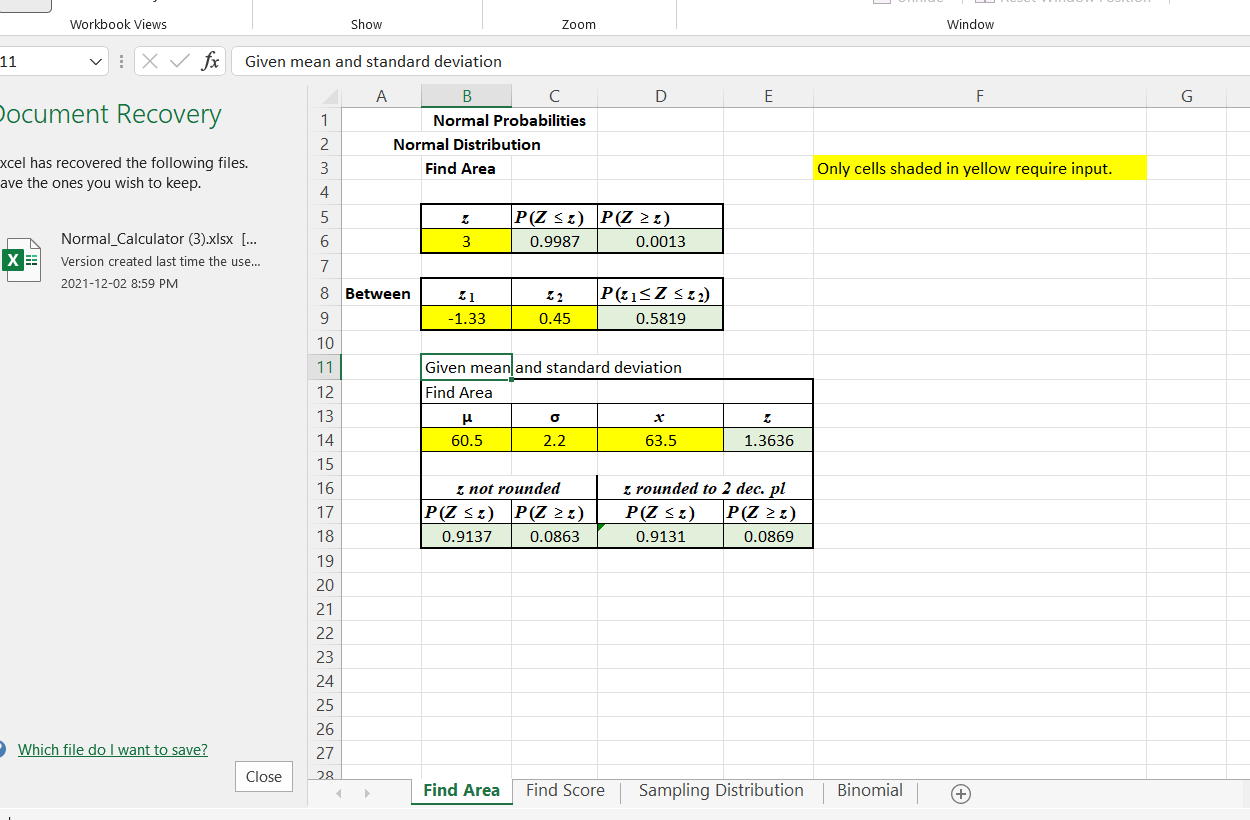
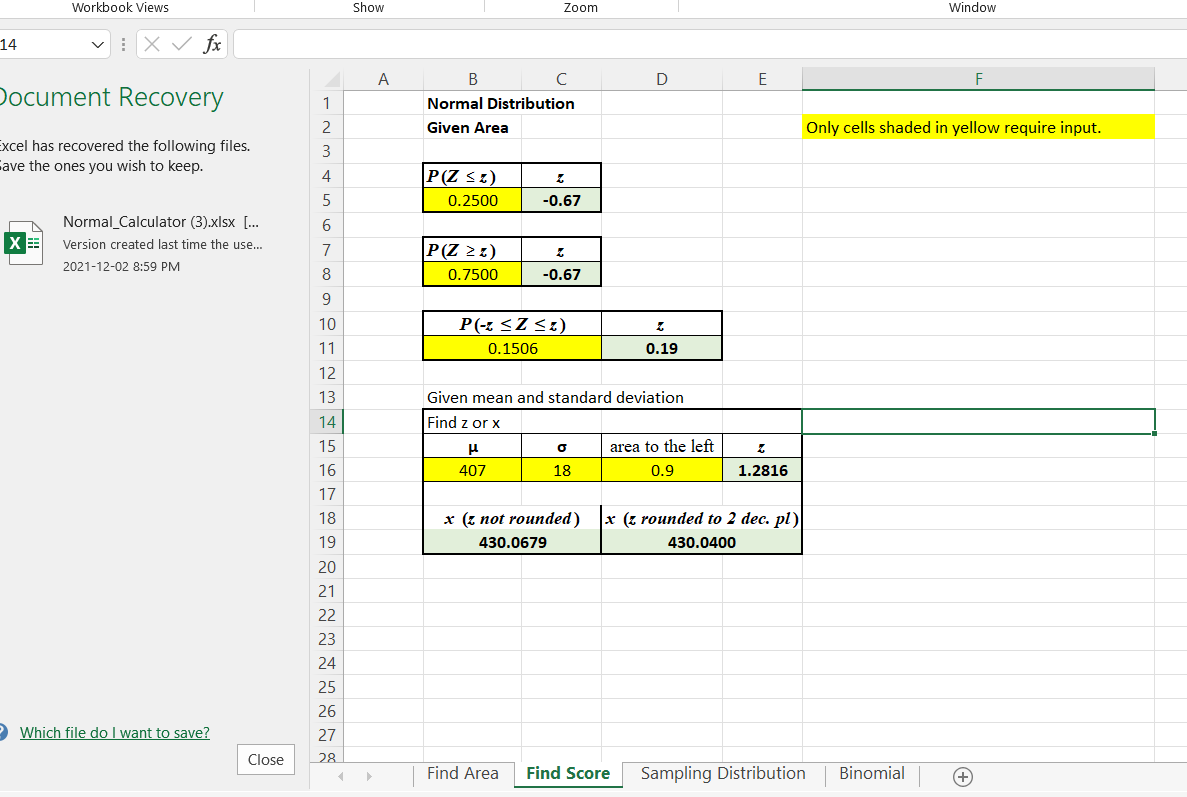
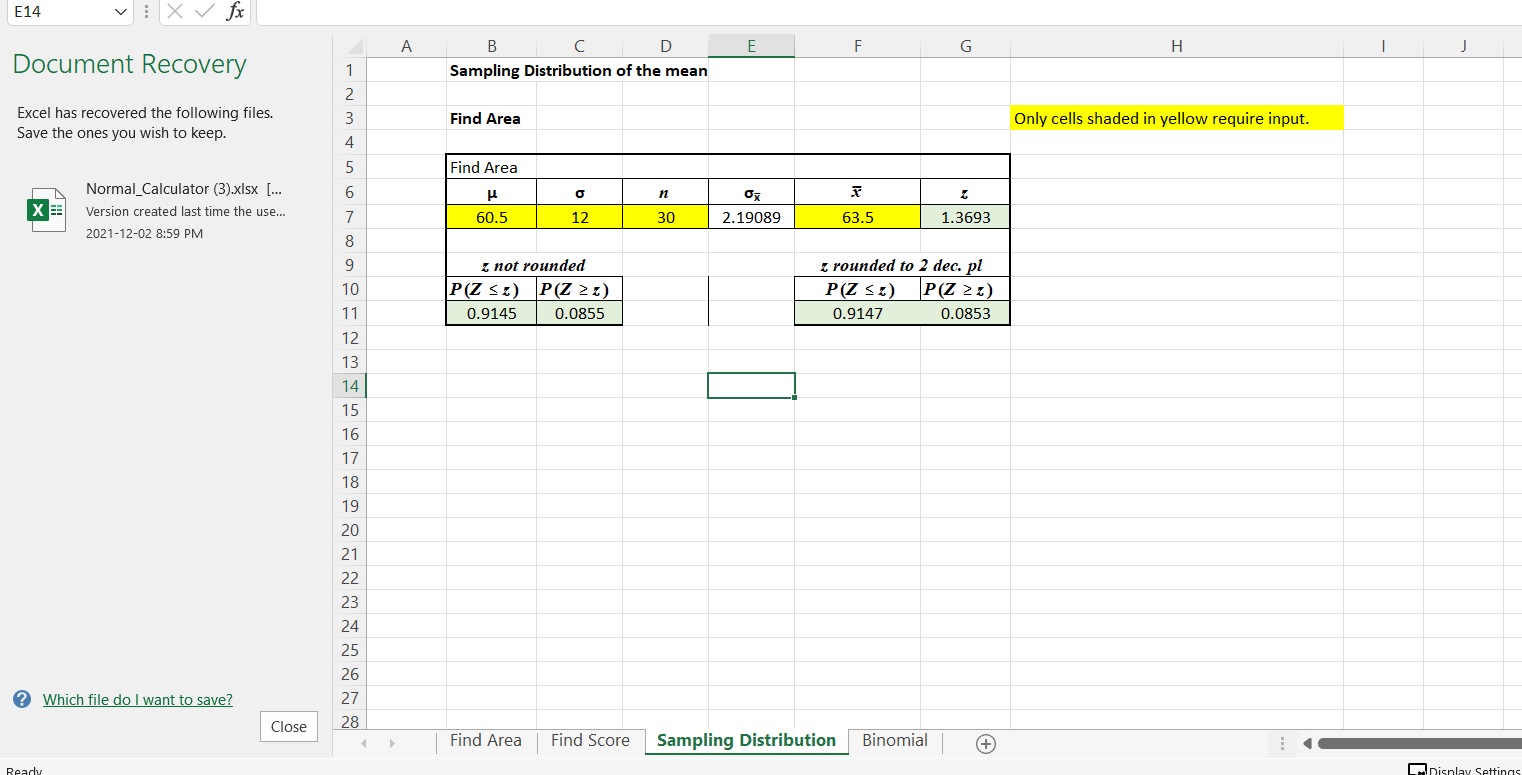
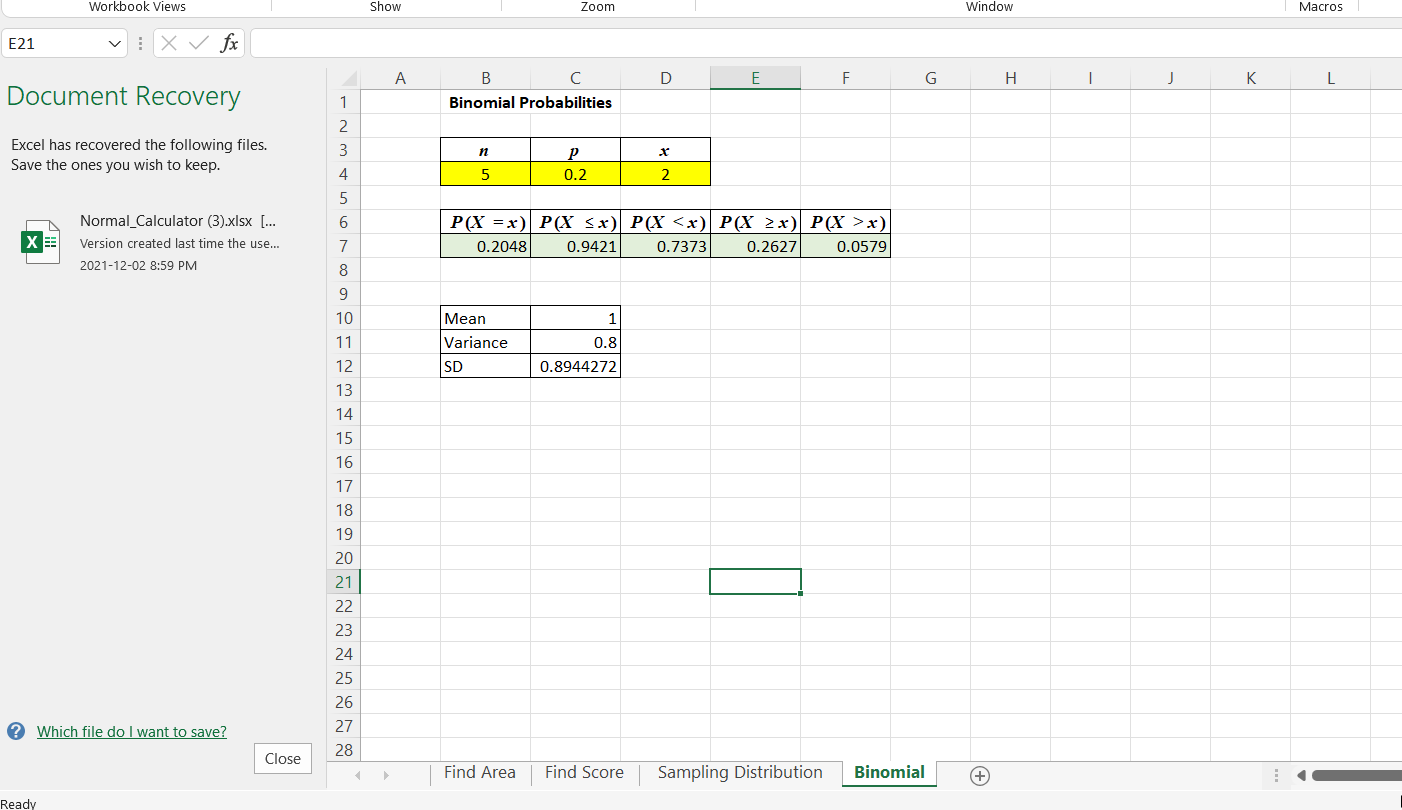
Consider a population with a mean / = 250 and standard deviation o = 79. Suppose random samples of size n = 79 are selected from this population. 1. a) What is the mean of the distribution of the sample mean? HI b) What is the standard error of the mean? (2 decimal places) In the following questions, round the standard error and z-scores to exactly 2 decimal places before determining probabilities. Report probabilities accurate to at least 3 decimal places. 2. What is the probability that a randomly selected sample mean is: a) greater than 244.1? b) less than 253.6? c) greater than 244.1 and less than 253.6? d) greater than 244.1 given less than 253.6? e) greater than 244.1 or greater than 253.6? 3. Between what values would you expect to find the middle 64% of the sample means? Round to the nearest integer. Place the smaller value in the first box and the larger value in the second box. Between and 4. Why are we able to use the normal distribution in the calculations above? O Because the sample size is large enough O Becasuse the standard error is large enough O Because the original population is normal O Because the sample mean is large enoughWorkbook Views Show Zoom Window 11 viXfx Given mean and standard deviation A B C D E F G ocument Recovery Normal Probabilities W N - Normal Distribution xcel has recovered the following files. Find Area Only cells shaded in yellow require input. ave the ones you wish to keep. 4 P(Z z) P(Z 25) Normal_Calculator (3).xIsx [... 3 0.9987 0.0013 X Version created last time the use... 00 2021-12-02 8:59 PM Between 9 -1.33 0.45 0.5819 10 11 Given mean and standard deviation 12 Find Area 13 o 14 60.5 2.2 3.5 1.3636 15 16 : not rounded : rounded to 2 dec. pl 17 P(Z S:) P(Z 2 :) P(Z SI) P(Z 2 5) 18 0.9137 0.0863 0.9131 0.0869 19 20 21 22 23 24 25 26 Which file do I want to save? 27 Close 28 Find Area Find Score Sampling Distribution | Binomial +Workbook Views Show Zoom Window 14 viX fx A B C D E F Document Recovery Normal Distribution IN Given Area Only cells shaded in yellow require input. xcel has recovered the following files. ave the ones you wish to keep. P(Z SI) 0.2500 -0.67 Normal_Calculator (3).xIsx [... Version created last time the use. P(Z 2 5 ) 2021-12-02 8:59 PM 8 0.7500 -0.67 9 10 P(- x) X L Version created last time the use... 0.2048 0.9421 0.7373 0.2627 0.0579 2021-12-02 8:59 PM 9 10 Mean 11 Variance 0.8 12 SD 0.8944272 13 14 15 16 18 19 20 21 22 23 24 25 26 ? Which file do I want to save? 27 Close 28 Find Area | Find Score | Sampling Distribution Binomial (+
Step by Step Solution
There are 3 Steps involved in it
Step: 1
Get Instant Access to Expert-Tailored Solutions
See step-by-step solutions with expert insights and AI powered tools for academic success
Step: 2
Step: 3
Ace Your Homework with AI
Get the answers you need in no time with our AI-driven, step-by-step assistance