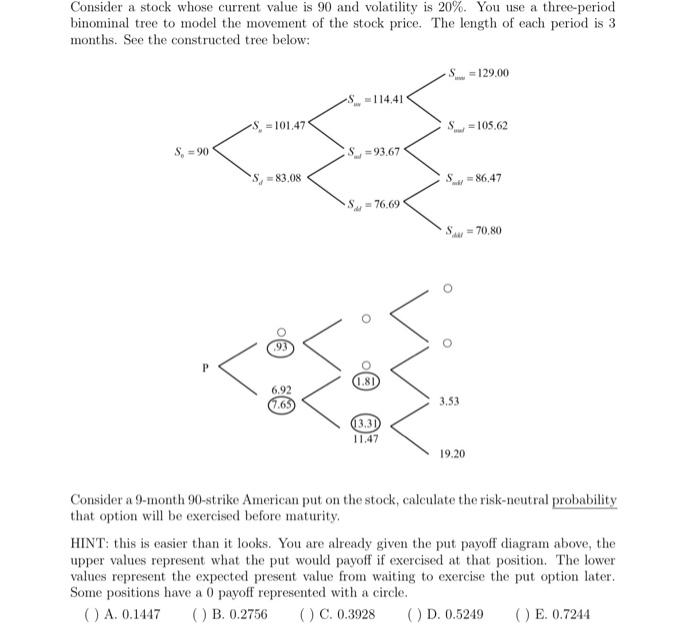
Consider a stock whose current value is 90 and volatility is 20%. You use a three-period binominal tree to model the movement of the stock price. The length of each period is 3 months. See the constructed tree below: = 129.00 S 114,41 S = 101.47 S..=105.62 $ = 90 S = 93.67 S, -83.08 S 86.47 S = 76.69 S = 70.80 o o 1.81 6.92 7.65 3,53 13,30 11.47 19.20 Consider a 9-month 90-strike American put on the stock, calculate the risk-neutral probability that option will be exercised before maturity. HINT: this is easier than it looks. You are already given the put payoff diagram above, the upper values represent what the put would payoff if exercised at that position. The lower values represent the expected present value from waiting to exercise the put option later. Some positions have a 0 payoff represented with a circle. (A.0.1447 B. 0.2756 (C. 0.3928 D. 0.5249 (E.0.7244 Consider a stock whose current value is 90 and volatility is 20%. You use a three-period binominal tree to model the movement of the stock price. The length of each period is 3 months. See the constructed tree below: = 129.00 S 114,41 S = 101.47 S..=105.62 $ = 90 S = 93.67 S, -83.08 S 86.47 S = 76.69 S = 70.80 o o 1.81 6.92 7.65 3,53 13,30 11.47 19.20 Consider a 9-month 90-strike American put on the stock, calculate the risk-neutral probability that option will be exercised before maturity. HINT: this is easier than it looks. You are already given the put payoff diagram above, the upper values represent what the put would payoff if exercised at that position. The lower values represent the expected present value from waiting to exercise the put option later. Some positions have a 0 payoff represented with a circle. (A.0.1447 B. 0.2756 (C. 0.3928 D. 0.5249 (E.0.7244