

Question
Consider historical data showing that the average annual rate of return on the S&P 500 portfolio over the past 85 years has averaged roughly 8%
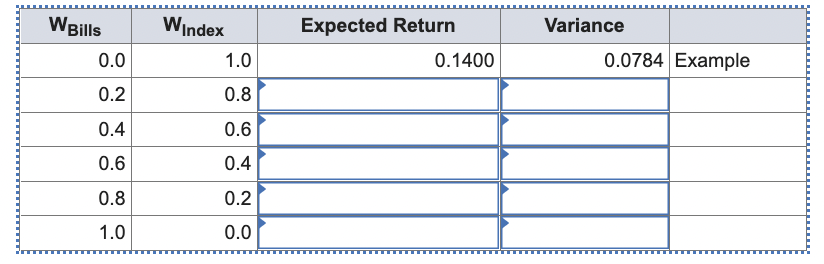
Consider historical data showing that the average annual rate of return on the S&P 500 portfolio over the past 85 years has averaged roughly 8% more than the Treasury bill return and that the S&P 500 standard deviation has been about 28% per year. Assume these values are representative of investors' expectations for future performance and that the current T-bill rate is 6%. Calculate the expected return and variance of portfolios invested in T-bills and the S&P 500 index with weights as shown below. (Enter your answers as decimals rounded to 4 places. Leave no cells blank - be certain to enter "0" wherever required.)
Step by Step Solution
There are 3 Steps involved in it
Step: 1

Get Instant Access to Expert-Tailored Solutions
See step-by-step solutions with expert insights and AI powered tools for academic success
Step: 2

Step: 3
Ace Your Homework with AI
Get the answers you need in no time with our AI-driven, step-by-step assistance
Get Started
Public Finance In Theory And Practice
Authors: Holley Ulbrich
2nd Edition
041558597X, 978-0415585972