

Question
?Consider historical data showing that the average annual rate of return on the a particular stock portfolio over the past 80 years has averaged roughly
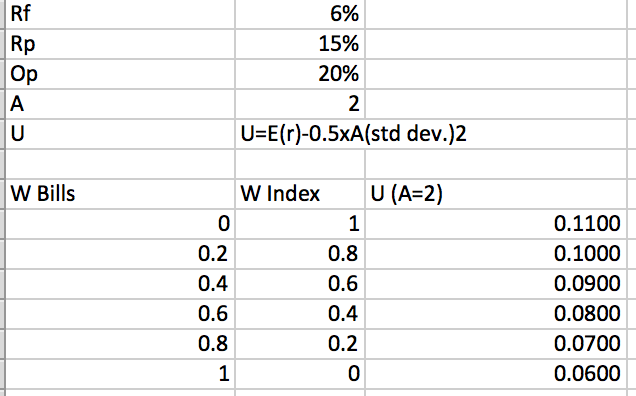
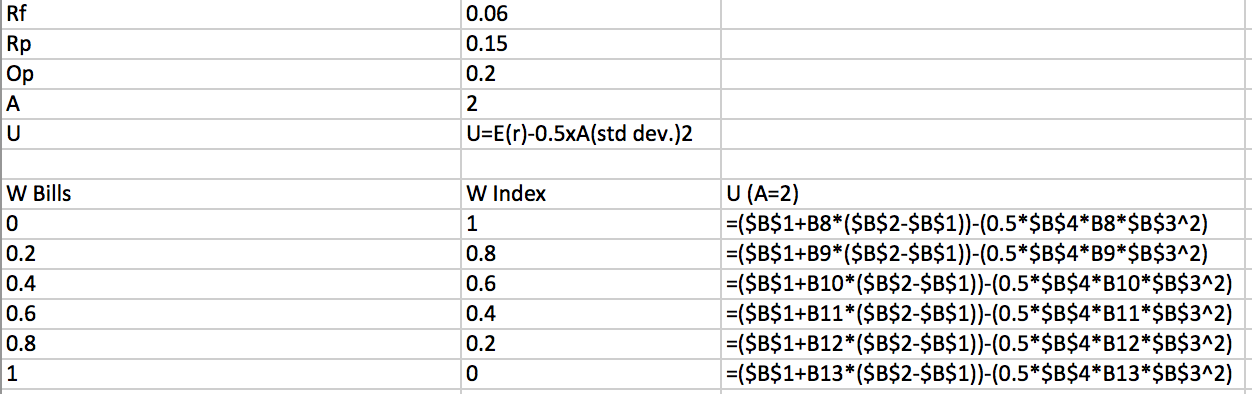
?Consider historical data showing that the average annual rate of return on the a particular stock portfolio over the past 80 years has averaged roughly 9% more than the Treasury bill return and that the stock portfolio standard deviation has been about 20% per year. Assume these values are representative of investors expectations for future performance and that the current T-bill rate is 6%. Calculate the utility levels of each portfolio for an investor with A = 2. Assume the utility function is U = E(r) 0.5 A?2.
The pictures are of my work...the first and last answers are correct, but the middle ones (.1, .09, .08, .07) are incorrect.
| W Bills | W Index | U (A=2) |
| 0 | 1 | |
| .2 | .8 | |
| .4 | .6 | |
| .6 | .4 | |
| .8 | .2 | |
| 1 | 0 |
Step by Step Solution
There are 3 Steps involved in it
Step: 1

Get Instant Access to Expert-Tailored Solutions
See step-by-step solutions with expert insights and AI powered tools for academic success
Step: 2

Step: 3
Ace Your Homework with AI
Get the answers you need in no time with our AI-driven, step-by-step assistance
Get Started
Emerging Markets And The Global Economy A Handbook
Authors: Mohammed El Hedi Arouri, Sabri Boubaker, Duc Khuong Nguyen
1st Edition
0124115497, 978-0124115491