Answered step by step
Verified Expert Solution
Question
1 Approved Answer
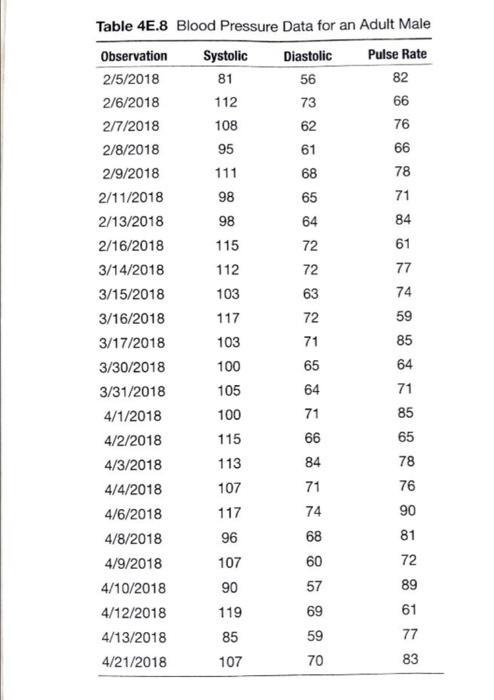
Consider the blood pressure and pulse data in Table 4E.8. Set up an EWMA control chart for the systolic blood pressure data using =


Consider the blood pressure and pulse data in Table 4E.8. Set up an EWMA control chart for the systolic blood pressure data using = 0.2. Does the blood pressure for this individual seem to be in a state of statistical control? What are some potential assignable causes for this process? Table 4E.8 Blood Pressure Data for an Adult Male Observation Systolic Diastolic Pulse Rate 2/5/2018 81 56 82 2/6/2018 112 73 66 2/7/2018 108 62 76 2/8/2018 95 61 66 2/9/2018 111 68 78 2/11/2018 98 65 71 2/13/2018 98 64 84 2/16/2018 115 72 61 3/14/2018 112 72 77 3/15/2018 103 63 74 3/16/2018 117 72 59 3/17/2018 103 71 85 3/30/2018 100 65 64 3/31/2018 105 64 71 4/1/2018 100 71 85 4/2/2018 115 66 65 4/3/2018 113 84 78 4/4/2018 107 71 76 4/6/2018 117 74 90 4/8/2018 96 68 81 4/9/2018 107 60 72 4/10/2018 90 57 89 4/12/2018 119 69 61 4/13/2018 85 59 77 4/21/2018 107 70 83
Step by Step Solution
There are 3 Steps involved in it
Step: 1

Get Instant Access to Expert-Tailored Solutions
See step-by-step solutions with expert insights and AI powered tools for academic success
Step: 2

Step: 3

Ace Your Homework with AI
Get the answers you need in no time with our AI-driven, step-by-step assistance
Get Started


