

Question
Consider the data contained in the table below, which lists 30 monthly excess returns to two different actively managed stock portfolios (A and B) and
Consider the data contained in the table below, which lists 30 monthly excess returns to two different actively managed stock portfolios (A and B) and three different common risk factors (1, 2, and 3). (Note: You may find it useful to use a computer spreadsheet program such as Microsoft Excel to calculate your answers.)
| ||||||||||||||||||||||||||||||||||||||||||||||||||||||||||||||||||||||||||||||||||||||||||||||||||||||||||||||||||||||||||||||||||||||||||||||||||||||||||||||||||||||||||||||||||||||||||||||||||||||||||||||||||||||||||||||||||||||||||||||||||||||||||||||||||||||||||||||||||||||||||||||||||||||||||||||||||||||||||||||||||||||||||||||||||||||||||||||||||||||||||||||||||||
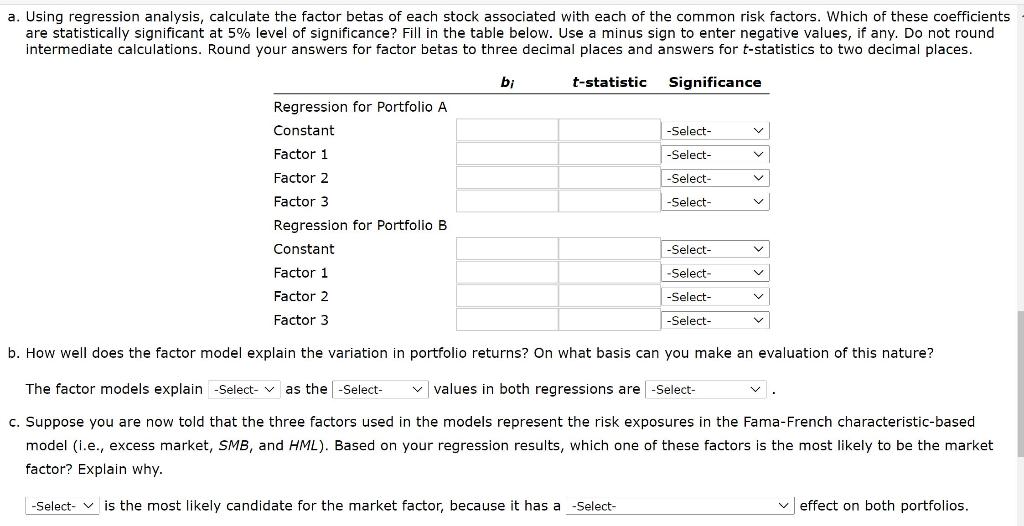
a. Using regression analysis, calculate the factor betas of each stock associated with each of the common risk factors. Which of these coefficients are statistically significant at 5% level of significance? Fill in the table below. Use a minus sign to enter negative values, if any. Do not round intermediate calculations. Round your answers for factor betas to three decimal places and answers for t-statistics to two decimal places. bi t-statistic Significance -Select- -Select- -Select- -Select- Regression for Portfolio A Constant Factor 1 Factor 2 Factor 3 Regression for Portfolio B Constant Factor 1 Factor 2 Factor 3 V -Select- -Select- -Select- -Select- v b. How well does the factor model explain the variation in portfolio returns? On what basis can you make an evaluation of this nature? The factor models explain -Select- as the -Select- values in both regressions are -Select- C. Suppose you are now told that the three factors used in the models represent the risk exposures in the Fama-French characteristic-based model (i.e., excess market, SMB, and HML). Based on your regression results, which one of these factors is the most likely to be the market factor? Explain why. -Select- v is the most likely candidate for the market factor, because it has a -Select- effect on both portfolios. a. Using regression analysis, calculate the factor betas of each stock associated with each of the common risk factors. Which of these coefficients are statistically significant at 5% level of significance? Fill in the table below. Use a minus sign to enter negative values, if any. Do not round intermediate calculations. Round your answers for factor betas to three decimal places and answers for t-statistics to two decimal places. bi t-statistic Significance -Select- -Select- -Select- -Select- Regression for Portfolio A Constant Factor 1 Factor 2 Factor 3 Regression for Portfolio B Constant Factor 1 Factor 2 Factor 3 V -Select- -Select- -Select- -Select- v b. How well does the factor model explain the variation in portfolio returns? On what basis can you make an evaluation of this nature? The factor models explain -Select- as the -Select- values in both regressions are -Select- C. Suppose you are now told that the three factors used in the models represent the risk exposures in the Fama-French characteristic-based model (i.e., excess market, SMB, and HML). Based on your regression results, which one of these factors is the most likely to be the market factor? Explain why. -Select- v is the most likely candidate for the market factor, because it has a -Select- effect on both portfolios
Step by Step Solution
There are 3 Steps involved in it
Step: 1

Get Instant Access to Expert-Tailored Solutions
See step-by-step solutions with expert insights and AI powered tools for academic success
Step: 2

Step: 3
Ace Your Homework with AI
Get the answers you need in no time with our AI-driven, step-by-step assistance
Get Started
The Almanack Of Stanley Druckenmiller From Over 40 Years Of Investing Wisdom With Quantum Fund And Duquesne Capital Management
Authors: Rui Zhi Dong
1st Edition
B0B3NV2H9M, 979-8850611453