

Question
consider the data contained in the table below which lists 30 monthly access returns to two different actively managed stock portfolios and three different common
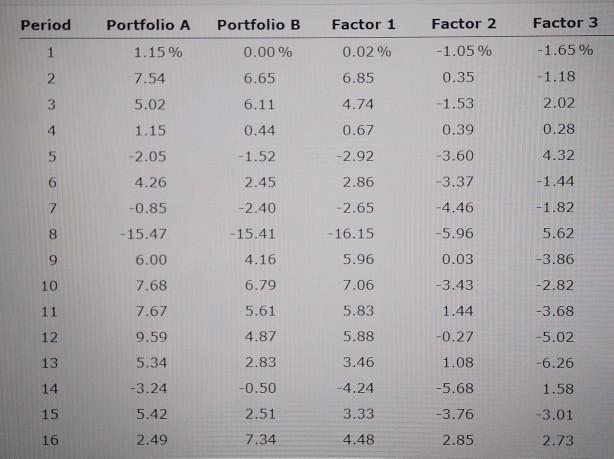
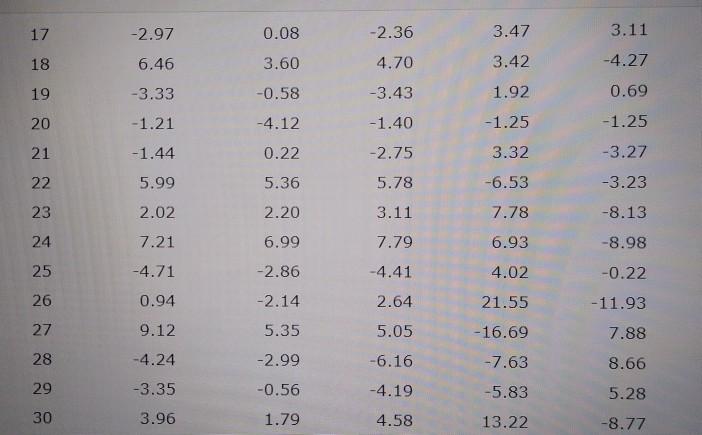
consider the data contained in the table below which lists 30 monthly access returns to two different actively managed stock portfolios and three different common risk factors you may find it useful to use a computer spreadsheet program such as Microsoft Excel to calculate your answers.
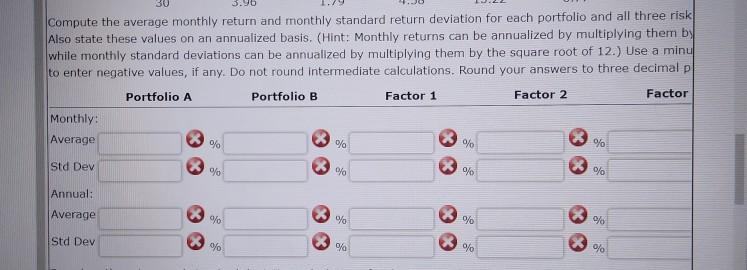
compute the average monthly return and monthly standard returned deviation for each portfolio and all three risk factors. also State these values on an annualized basis. monthly returns can be annualized by multiplying them by 12 while monthly standard deviations can be annualized by multiplying them by the square root of 12. use a minus sign to enter negative values if any period do not round intermediate calculations. round your answers to three decimal places.
Period Portfolio A Portfolio B Factor 1 Factor 2 Factor 3 1 1.15% 0.00% 0.02% -1.05% -1.65% 2 6.65 0.35 -1.18 7.54 5.02 1.15 6.85 4.74 3 6.11 -1.53 2.02 4 0.44 0.67 0.28 0.39 -3.60 -1.52 -2.92 4.32 -2.05 4.26 6 2.45 2.86 -3.37 -1.44 -0.85 -2.40 -2.65 4.46 -1.82 8 -15.47 -15.41 -5.96 5.62 -16.15 5.96 9 6.00 4.16 0.03 -3.86 10 7.68 6.79 7.06 -3.43 -2.82 11 7.67 5.61 5.83 1.44 -3.68 12 9.59 4.87 5.88 -0.27 -5.02 13 5.34 2.83 3.46 1.08 -6.26 14 -3.24 -0.50 -4.24 1.58 -5.68 -3.76 15 5.42 2.51 3.33 -3.01 16 2.49 7.34 4.48 2.85 2.73 17 -2.97 0.08 -2.36 3.47 3.11 18 6.46 3.60 4.70 3.42 4.27 19 -3.33 -0.58 -3.43 0.69 20 -1.21 -4.12 -1.40 -1.25 21 -1.44 0.22 -2.75 3.27 22 5.99 5.36 5.78 1.92 -1.25 3.32 -6.53 7.78 6.93 4.02 -3.23 23 2.02 2.20 3.11 -8.13 24 7.21 6.99 7.79 -8.98 25 -4.71 -2.86 4.41 -0.22 -11.93 26 0.94 -2.14 2.64 21.55 27 9.12 5.05 -15.69 5.35 -2.99 7.88 8.66 28 -4.24 -6.16 -7.63 29 -3.35 -0.56 -4.19 -5.83 5.28 30 3.96 1.79 4.58 13.22 -8.77 3.96 Compute the average monthly return and monthly standard return deviation for each portfolio and all three risk Also state these values on an annualized basis. (Hint: Monthly returns can be annualized by multiplying them by while monthly standard deviations can be annualized by multiplying them by the square root of 12.) Use a minu to enter negative values, if any. Do not round Intermediate calculations. Round your answers to three decimal D Portfolio A Portfolio B Factor 1 Factor 2 Factor Monthly Average % % % . % yo Std Dev % % % % Annual: Average S % % % % Std Dev % % % %Step by Step Solution
There are 3 Steps involved in it
Step: 1

Get Instant Access to Expert-Tailored Solutions
See step-by-step solutions with expert insights and AI powered tools for academic success
Step: 2

Step: 3
Ace Your Homework with AI
Get the answers you need in no time with our AI-driven, step-by-step assistance
Get Started
Finance A Quantitative Introduction Volume 1
Authors: Piotr Staszkiewicz, Lucia Staszkiewicz
1st Edition
0128015845, 978-0128015841