Answered step by step
Verified Expert Solution
Question
1 Approved Answer
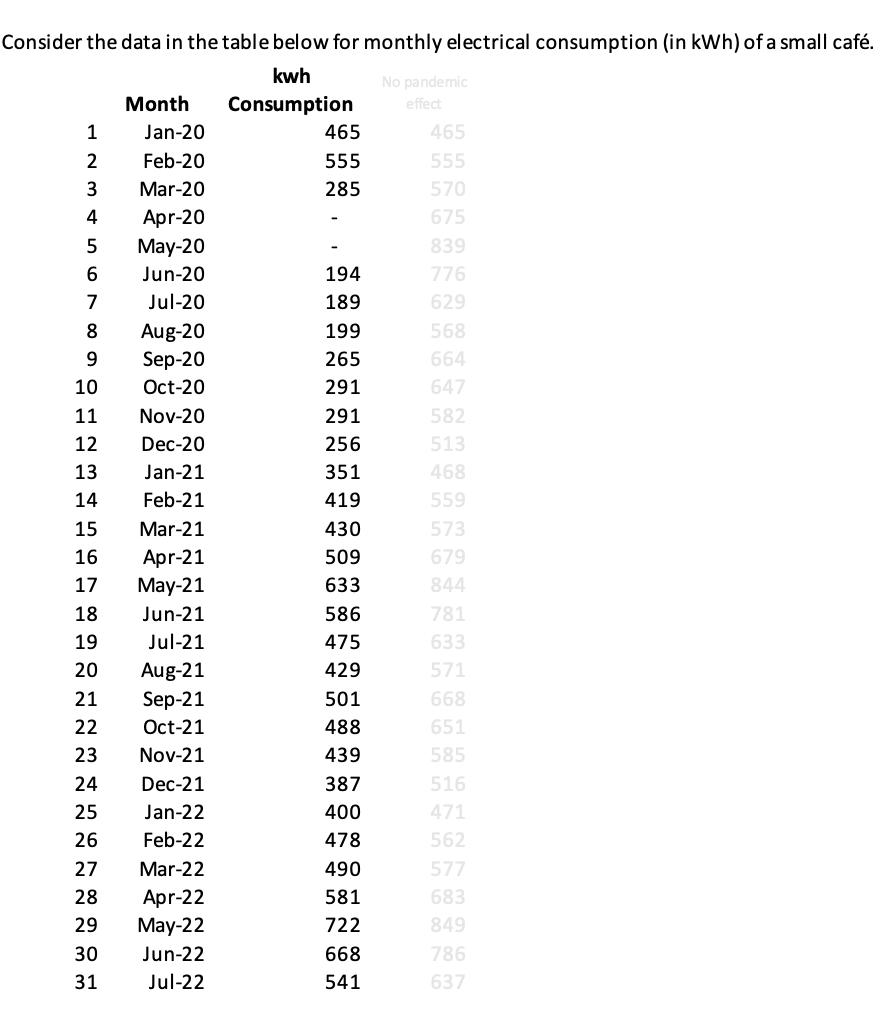
Consider the data in the table below for monthly electrical consumption (in kWh) of a small caf. kwh Consumption Month Jan-20 Feb-20 Mar-20 Apr-20


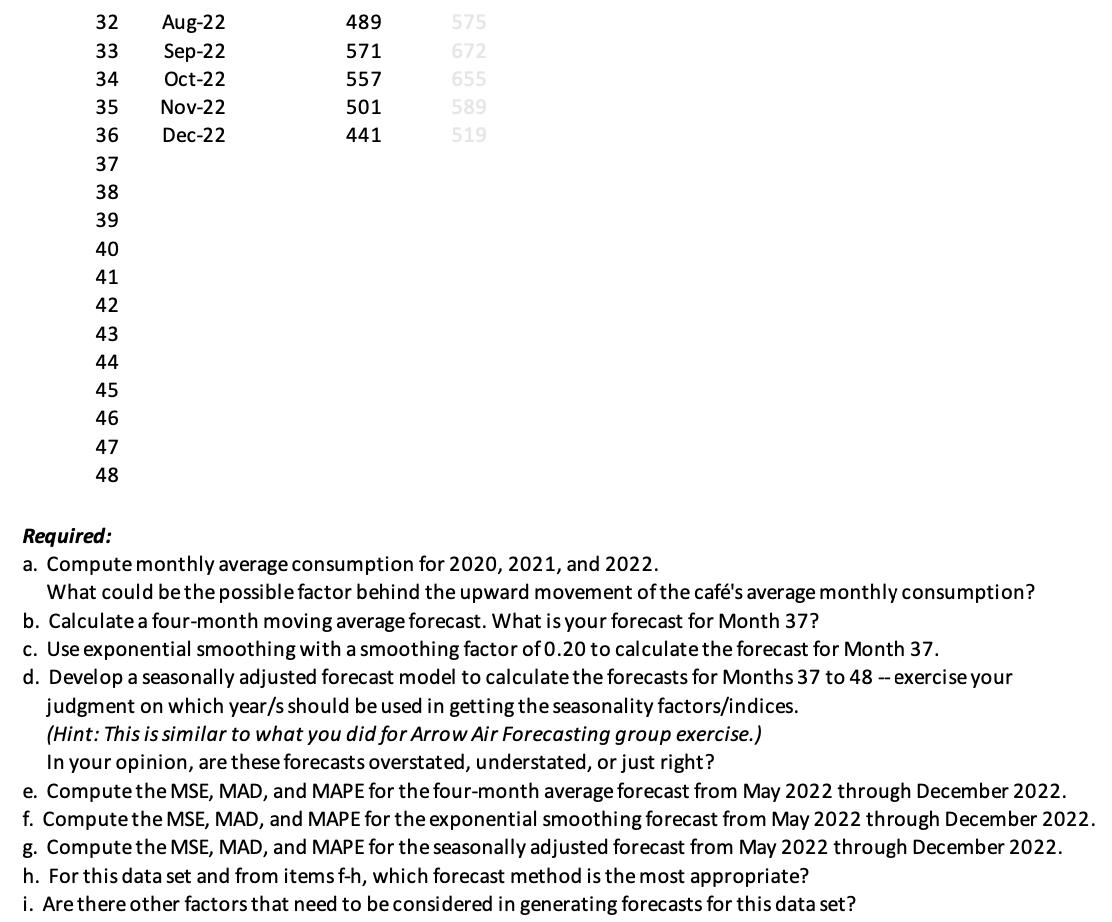
Consider the data in the table below for monthly electrical consumption (in kWh) of a small caf. kwh Consumption Month Jan-20 Feb-20 Mar-20 Apr-20 May-20 Jun-20 Jul-20 1 2 3 4 5 6 7 8 Aug-20 Sep-20 Oct-20 9 10 11 Nov-20 12 Dec-20 13. Jan-21 14 Feb-21 15 Mar-21 16 Apr-21 17 May-21 18 Jun-21 19 Jul-21 20 Aug-21 21 Sep-21 22 Oct-21 23 Nov-21 24 Dec-21 25 Jan-22 26 Feb-22 27 Mar-22 28 Apr-22 29 May-22 30 Jun-22 31 Jul-22 465 555 285 194 189 199 265 291 291 256 351 419 430 509 633 586 475 429 501 488 439 387 400 478 490 581 722 668 541 No pandemic effect 465 555 570 675 839 776 629 568 664 647 582 513 468 559 573 679 844 781 633 571 668 651 585 516 471 562 577 683 849 786 637 32 33 34 35 36 37 38 39 40 41 42 43 44 45 46 47 48 Aug-22 Sep-22 Oct-22 Nov-22 Dec-22 489 571 557 501 441 575 672 655 589 519 Required: a. Compute monthly average consumption for 2020, 2021, and 2022. What could be the possible factor behind the upward movement of the caf's average monthly consumption? b. Calculate a four-month moving average forecast. What is your forecast for Month 37? c. Use exponential smoothing with a smoothing factor of 0.20 to calculate the forecast for Month 37. d. Develop a seasonally adjusted forecast model to calculate the forecasts for Months 37 to 48 - exercise your judgment on which year/s should be used in getting the seasonality factors/indices. (Hint: This is similar to what you did for Arrow Air Forecasting group exercise.) In your opinion, are these forecasts overstated, understated, or just right? e. Compute the MSE, MAD, and MAPE for the four-month average forecast from May 2022 through December 2022. f. Compute the MSE, MAD, and MAPE for the exponential smoothing forecast from May 2022 through December 2022. g. Compute the MSE, MAD, and MAPE for the seasonally adjusted forecast from May 2022 through December 2022. h. For this data set and from items f-h, which forecast method is the most appropriate? i. Are there other factors that need to be considered in generating forecasts for this data set?
Step by Step Solution
★★★★★
3.48 Rating (145 Votes )
There are 3 Steps involved in it
Step: 1
a To calculate the monthly average consumption for 2020 2021 and 2022 we need to sum up the consumption values for each year and then divide by the nu...
Get Instant Access to Expert-Tailored Solutions
See step-by-step solutions with expert insights and AI powered tools for academic success
Step: 2

Step: 3

Ace Your Homework with AI
Get the answers you need in no time with our AI-driven, step-by-step assistance
Get Started


