

Answered step by step
Verified Expert Solution
Question
1 Approved Answer
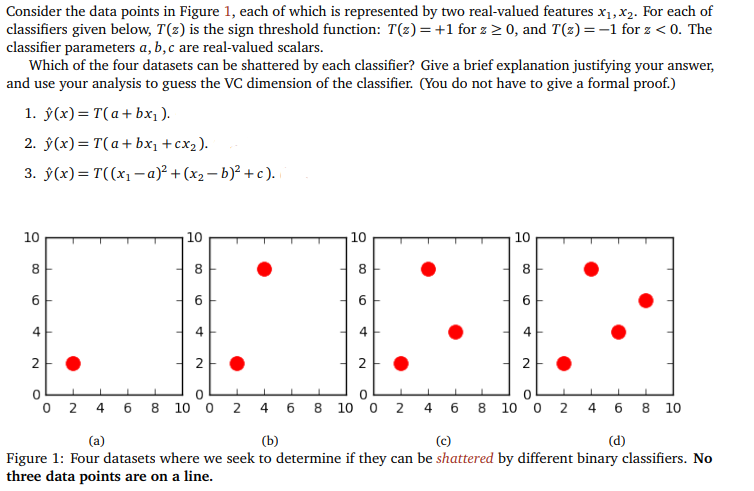
Consider the data points in Figure 1, each of which is represented by two real-valued features xi, x2. For each of classifiers given below, T(z)
Step by Step Solution
There are 3 Steps involved in it
Step: 1

Get Instant Access to Expert-Tailored Solutions
See step-by-step solutions with expert insights and AI powered tools for academic success
Step: 2

Step: 3
Ace Your Homework with AI
Get the answers you need in no time with our AI-driven, step-by-step assistance
Get Started
Handbook Of Research On Global Issues In Financial Communication And Investment Decision Making
Authors: Hasan Dinçer , Serhat Yüksel
1st Edition
1522592652,1522592687