Question: Consider the data set introduced in question one. We are interested in the impact of age at the time treatment starts and hospital type (public
Consider the data set introduced in question one. We are interested in the impact of age at the time treatment starts and hospital type (public vs private) on treatment time. The next four pages provide relevant output (diagnostic plots, model summary) for four possible models (MODEL A, . . ., MODEL D) used to assess the relationship between treatment time and age of the patient at the start of their treatment and hospital type.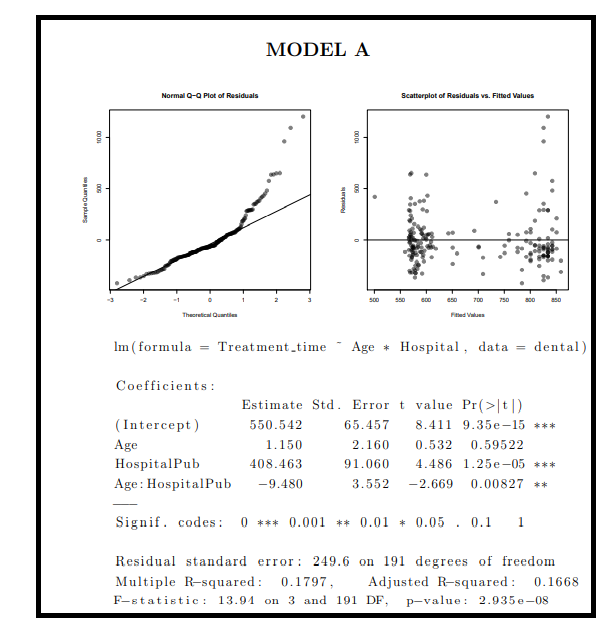
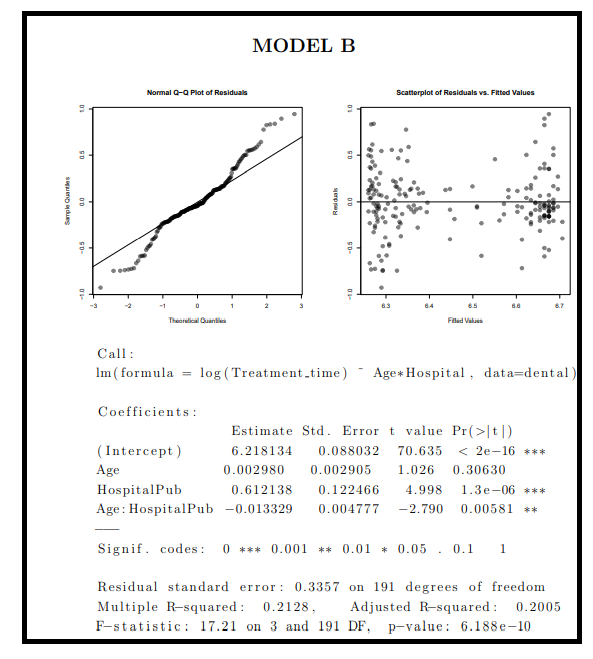
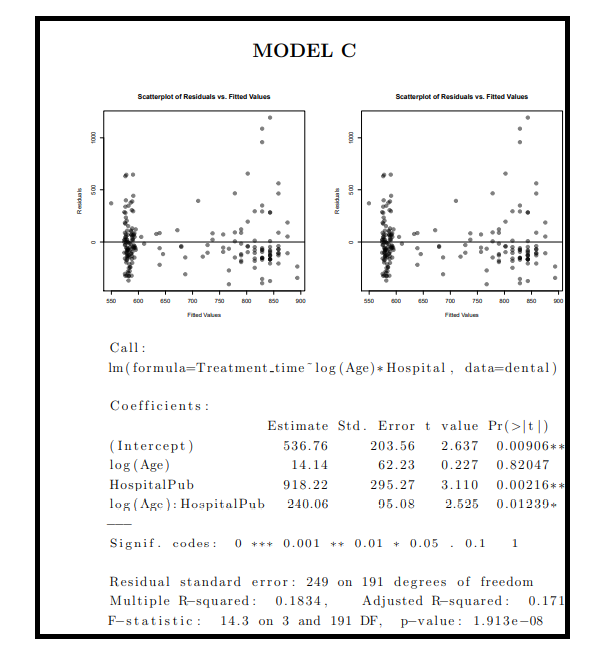
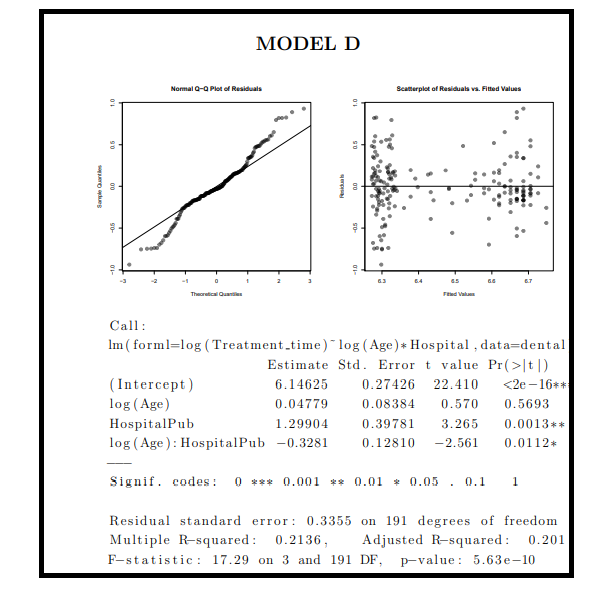
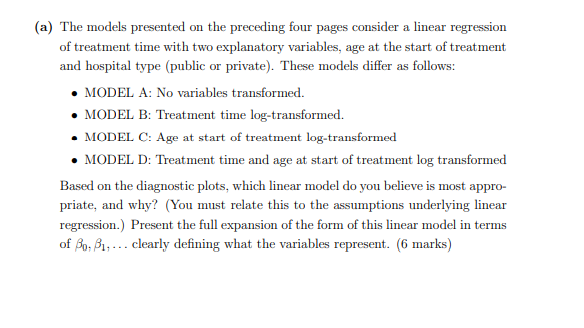



MODEL A Normal 0-9 Plot of Residuals Scatterplot of Residuals vs. Fitted Values 1000 mo 500 BD 750 800 30 650 700 Fitbed Values Theoretical and Im (formula Treatment time Age * Hospital, data dental) Coefficients : (Intercept) Age HospitalPub Age: HospitalPub Estimate Std. Error t value Pr(>It) 550.542 65.457 8.411 9.35e-15 *** 1.150 2.160 0.532 0.59522 408.463 91.060 4.486 1.25e-05 *** -9.480 3.552 -2.669 0.00827 ** Signif. codes: 0 *** 0.001 ** 0.01 + 0.05 . 0.1 1 Residual standard error: 249.6 on 191 degrees of freedom Multiple R-squared: 0.1797, Adjusted R-squared: 0.1668 F-statistic: 13.91 on 3 and 191 DF, p-value: 2.935e-08 MODEL B Normal Q-Plot of Residuals Scatterplot of Residuals vs. Fitted Values LO 05 Sample Quarties 00 Residuals 05 0 6.5 8.7 Than Filled Values Call : Im (formula log (Treatment.time) - Age* Hospital, data=dental) Coefficients: Estimate Std. Error t value Pr(>It) (Intercept) 6.218134 0.088032 70.635 It) (Intercept) 536.76 203.56 2.637 0.00906** log Age) 14.14 62.23 0.227 0.82047 HospitalPub 918.22 295.27 3.110 0.00216** log (Age): HospitalPub 240.06 95.08 2.525 0.012304 Signif. codes: 0 +++ 0.001 *+ 0.01 * 0.05 0.1 1 Residual standard error: 249 on 191 degrees of freedom Multiple R-squared: 0.1834, Adjusted R-squared: 0.171 F-statistic: 14.3 on 3 and 191 DF, p-value: 1.913e-08 MODEL D Normal Q-Plot of Residuals Scatterplot of Residuals vs. Fitted Values Says Qurthes - nh an 0 65 6.7 Theoretical Call: Im( forml=log (Treatment_time) log (Age)* Hospital, data=dental Estimate Std. Error t value Pr(>It (Intercept) 6.14625 0.27426 22.410 It) 550.542 65.457 8.411 9.35e-15 *** 1.150 2.160 0.532 0.59522 408.463 91.060 4.486 1.25e-05 *** -9.480 3.552 -2.669 0.00827 ** Signif. codes: 0 *** 0.001 ** 0.01 + 0.05 . 0.1 1 Residual standard error: 249.6 on 191 degrees of freedom Multiple R-squared: 0.1797, Adjusted R-squared: 0.1668 F-statistic: 13.91 on 3 and 191 DF, p-value: 2.935e-08 MODEL B Normal Q-Plot of Residuals Scatterplot of Residuals vs. Fitted Values LO 05 Sample Quarties 00 Residuals 05 0 6.5 8.7 Than Filled Values Call : Im (formula log (Treatment.time) - Age* Hospital, data=dental) Coefficients: Estimate Std. Error t value Pr(>It) (Intercept) 6.218134 0.088032 70.635 It) (Intercept) 536.76 203.56 2.637 0.00906** log Age) 14.14 62.23 0.227 0.82047 HospitalPub 918.22 295.27 3.110 0.00216** log (Age): HospitalPub 240.06 95.08 2.525 0.012304 Signif. codes: 0 +++ 0.001 *+ 0.01 * 0.05 0.1 1 Residual standard error: 249 on 191 degrees of freedom Multiple R-squared: 0.1834, Adjusted R-squared: 0.171 F-statistic: 14.3 on 3 and 191 DF, p-value: 1.913e-08 MODEL D Normal Q-Plot of Residuals Scatterplot of Residuals vs. Fitted Values Says Qurthes - nh an 0 65 6.7 Theoretical Call: Im( forml=log (Treatment_time) log (Age)* Hospital, data=dental Estimate Std. Error t value Pr(>It (Intercept) 6.14625 0.27426 22.410
Step by Step Solution
There are 3 Steps involved in it

Get step-by-step solutions from verified subject matter experts


