Question
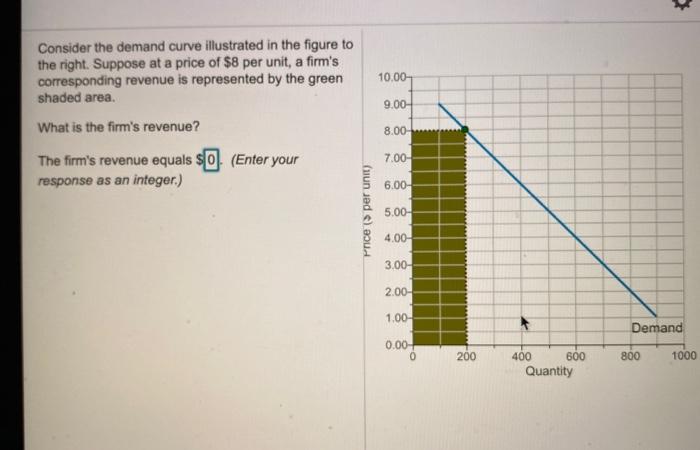
Consider the demand curve illustrated in the figure to the right. Suppose at a price of $8 per unit, a firm's corresponding revenue is

Consider the demand curve illustrated in the figure to the right. Suppose at a price of $8 per unit, a firm's corresponding revenue is represented by the green 10.00- shaded area. 9.00- What is the firm's revenue? 8.00- The firm's revenue equals $0. (Enter your 7.00- response as an integer.) 6.00- 5.00- 4.00- 3.00- 2.00- 1.00- Demand 0.00- 200 1000 400 600 Quantity 800 Price (S per unity
Step by Step Solution
3.50 Rating (163 Votes )
There are 3 Steps involved in it
Step: 1
Answer Total Revenue TR is found by multiply...
Get Instant Access to Expert-Tailored Solutions
See step-by-step solutions with expert insights and AI powered tools for academic success
Step: 2

Step: 3

Ace Your Homework with AI
Get the answers you need in no time with our AI-driven, step-by-step assistance
Get StartedRecommended Textbook for
Microeconomics and Behavior
Authors: Robert Frank
9th edition
9780077723750, 78021693, 77723759, 978-0078021695
Students also viewed these Economics questions
Question
Answered: 1 week ago
Question
Answered: 1 week ago
Question
Answered: 1 week ago
Question
Answered: 1 week ago
Question
Answered: 1 week ago
Question
Answered: 1 week ago
Question
Answered: 1 week ago
Question
Answered: 1 week ago
Question
Answered: 1 week ago
Question
Answered: 1 week ago
Question
Answered: 1 week ago
Question
Answered: 1 week ago
Question
Answered: 1 week ago
Question
Answered: 1 week ago
Question
Answered: 1 week ago
Question
Answered: 1 week ago
Question
Answered: 1 week ago
Question
Answered: 1 week ago
Question
Answered: 1 week ago
Question
Answered: 1 week ago
Question
Answered: 1 week ago
Question
Answered: 1 week ago
View Answer in SolutionInn App


