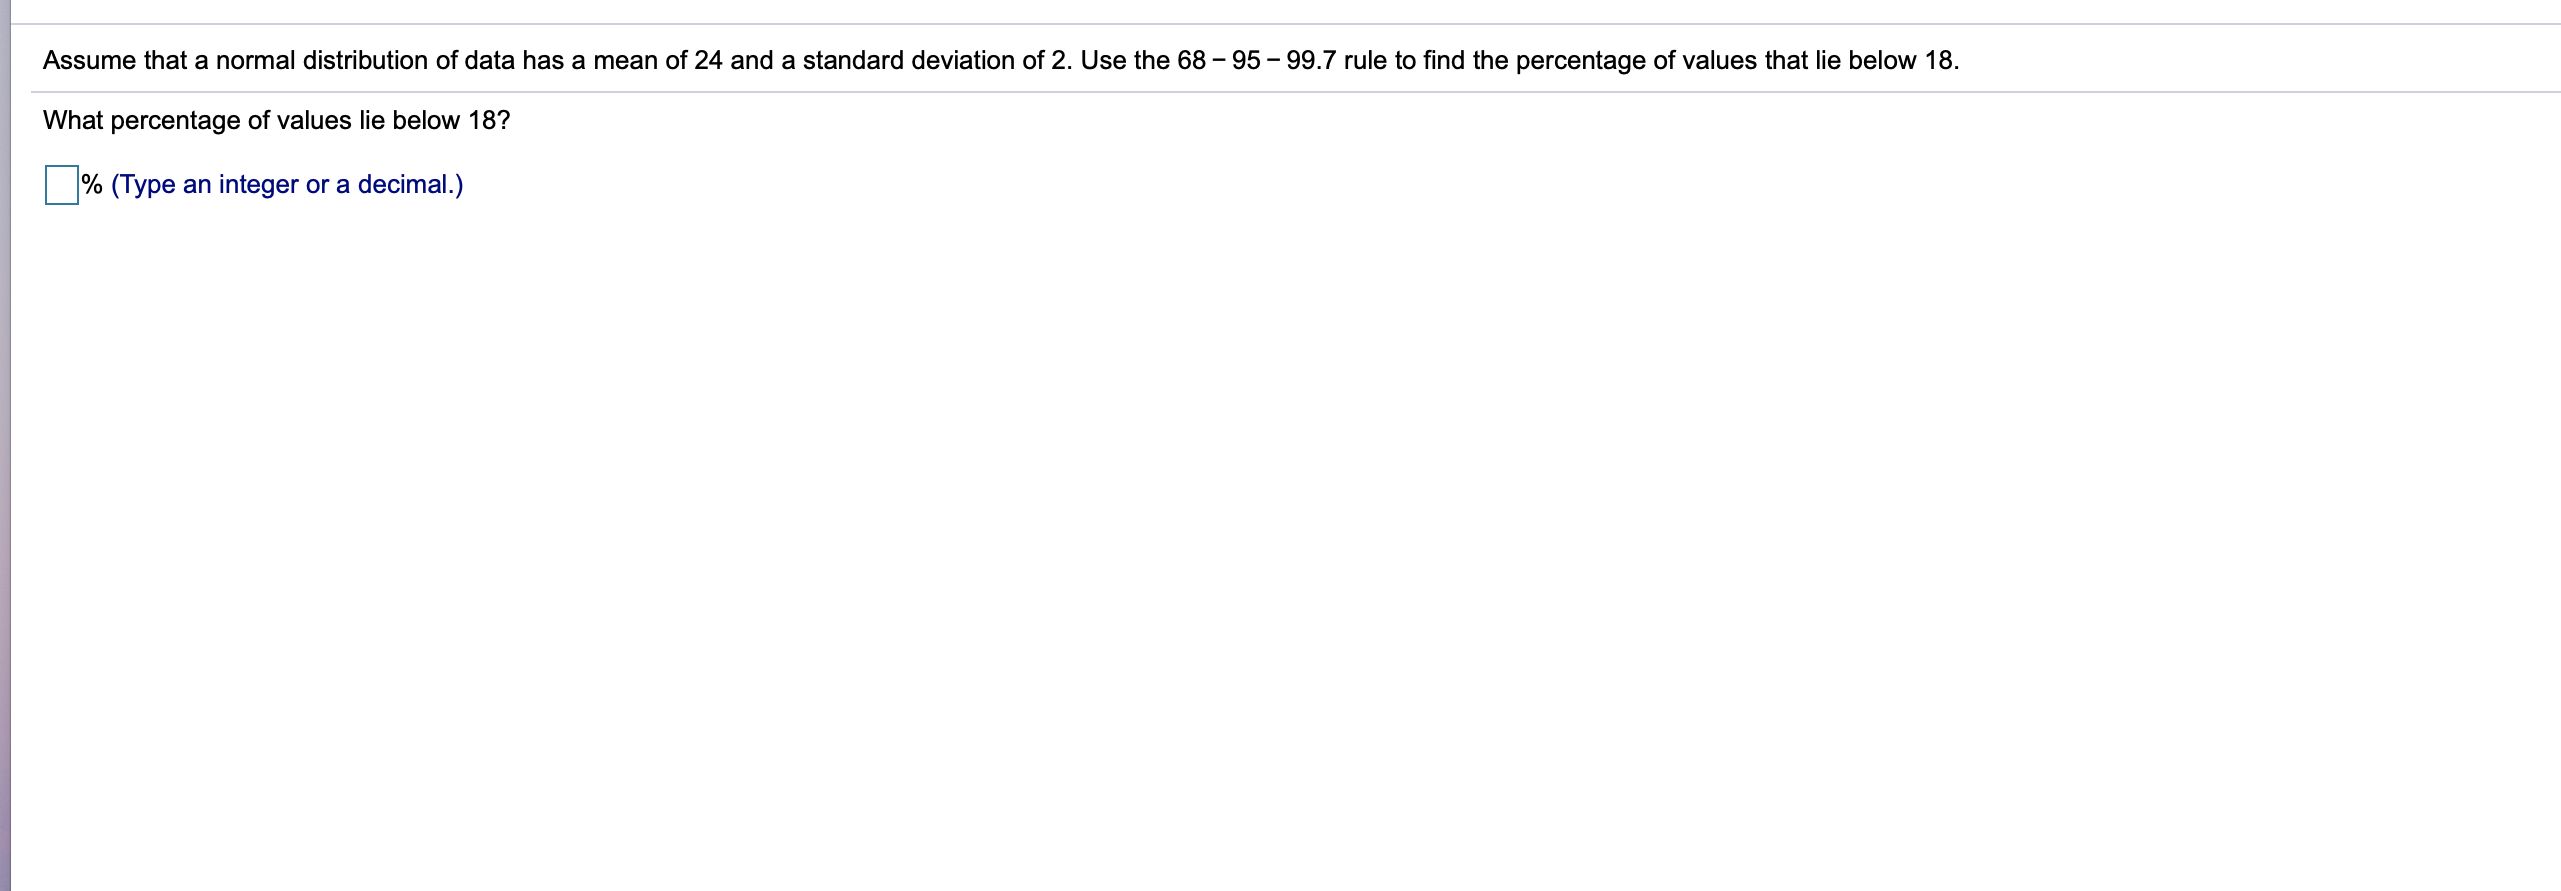
Consider the distributions given by the bar graphs below. Can you simply look at the graphs to decide which of the distributions has the greater standard deviation? If so, describe what you look for in the graphs on which to base your decision. Bar Graph 1 Bar Graph 2 13 6 E 10 E 4. m 5 a) = = u' 6 :r 2 4 2 2 u. 2 LL 00123456789101112 0123456 Number of Customers Values Bar graph 13 has the greater standard deviation because the distribution appears to be 'V spread out. A normal distribution has a mean at 16 and a standard deviation of 5. Use the 68-95-99] rule to nd the percentage of values in the distribution between 18 and 33. What is the percentage of values in the distribution between 18 and 337 % Suppose for a given month, the mean daily closing price for stock A was 114.65 and the standard deviation was 11.1. For stock B, the mean daily closing price was 86.04 with a standard deviation of 9.4. Which stock was more volatile? Stocks with greater coefficients of variation are considered more volatile. Which stock was more volatile? 202 O Stock B O Stock AFind the range, mean, and standard deviation of the following data set. (12, 13, 14, 15, 16, 17, 18, 19, 20, 21} The range is (Type a whole number.) The mean is]. (Type a decimal rounded to one decimal place as needed.) The standard deviation is. (Do not round until the final answer. Then round to three decimal places as needed.)As the manager of the human resources department at your firm, you are investigating the number of sick days employees took during the last calendar year. For employees in the marketing area, the average number of sick days is 4.7 with standard deviation 2.1; for those in the research and design (R&D), the mean is 5.3 with standard deviation 3.1. Compute and compare the coefficients of variation for each set of data. What is the coefficient of variation for the marketing area? CV=% (Round to one decimal place as needed.) What is the coefficient of variation for the research and design (R&D) area? CV= 1% (Round to one decimal place as needed.) Which area of the firm has more variability? O research and design area O marketing areaAssume that a normal distribution of data has a mean of 11 and a standard deviation of 2. Use the 68 -95 - 99.7 rule to find the percentage of values that lie above 13. What percentage of values lie above 13? % (Type an integer or a decimal.)Assume that a normal distribution of data has a mean of 24 and a standard deviation of 2. Use the 68 - 95 - 99.7 rule to nd the percentage of values that lie below 18. What percentage of values lie below 18? :|% (Type an integer or a decimal.)


