Answered step by step
Verified Expert Solution
Question
1 Approved Answer
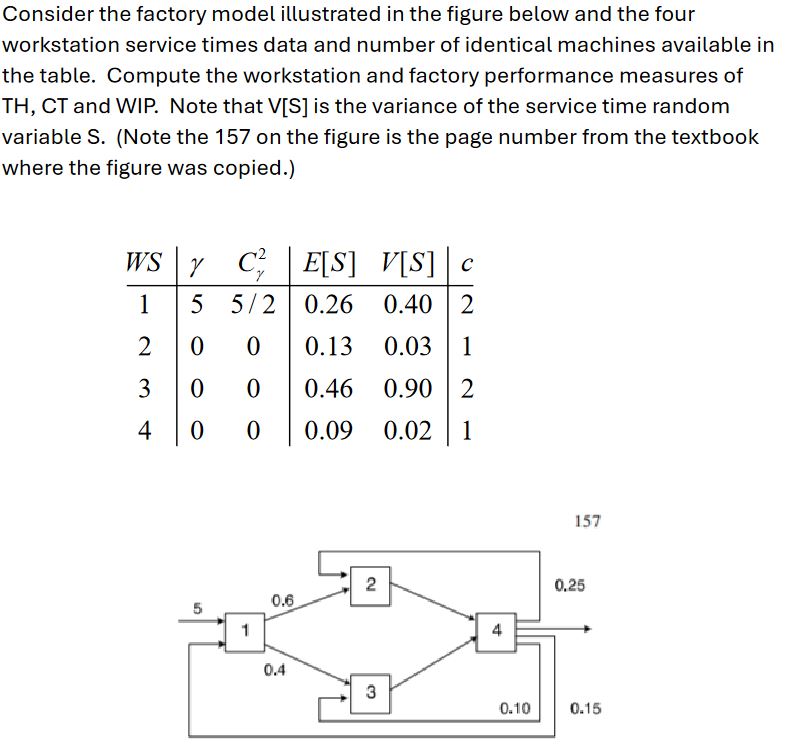
Consider the factory model illustrated in the figure below and the four workstation service times data and number of identical machines available in the table.
Consider the factory model illustrated in the figure below and the four
workstation service times data and number of identical machines available in
the table. Compute the workstation and factory performance measures of
TH CT and WIP. Note that VS is the variance of the service time random
variable Note the on the figure is the page number from the textbook
where the figure was copied.

Step by Step Solution
There are 3 Steps involved in it
Step: 1

Get Instant Access to Expert-Tailored Solutions
See step-by-step solutions with expert insights and AI powered tools for academic success
Step: 2

Step: 3

Ace Your Homework with AI
Get the answers you need in no time with our AI-driven, step-by-step assistance
Get Started


