

Answered step by step
Verified Expert Solution
Question
1 Approved Answer
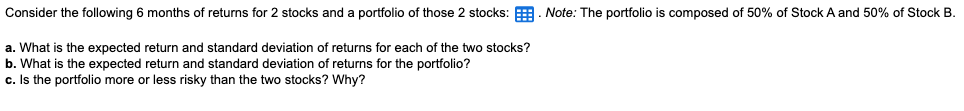
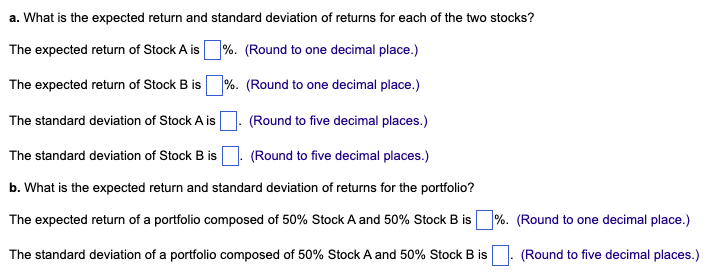
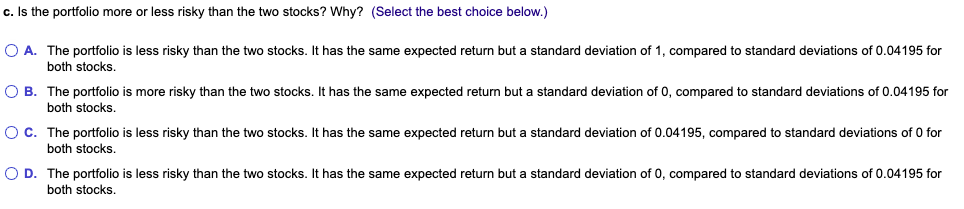
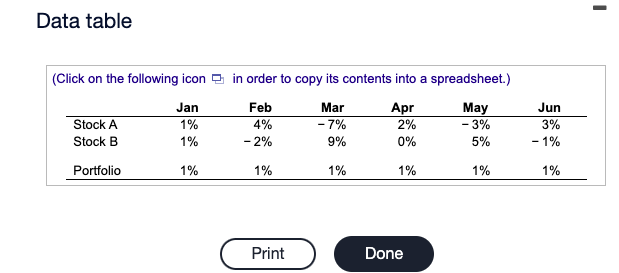
Consider the following 6 months of returns for 2 stocks and a portfolio of those 2 stocks: E. Note: The portfolio is composed of 50%
Step by Step Solution
There are 3 Steps involved in it
Step: 1

Get Instant Access to Expert-Tailored Solutions
See step-by-step solutions with expert insights and AI powered tools for academic success
Step: 2

Step: 3
Ace Your Homework with AI
Get the answers you need in no time with our AI-driven, step-by-step assistance
Get Started
Financing High Tech Startups Using Productive Signaling To Efficiently Overcome The Liability Of Complexity
Authors: Robin P. G. Tech
1st Edition
331966154X,3319661558