Answered step by step
Verified Expert Solution
Question
1 Approved Answer
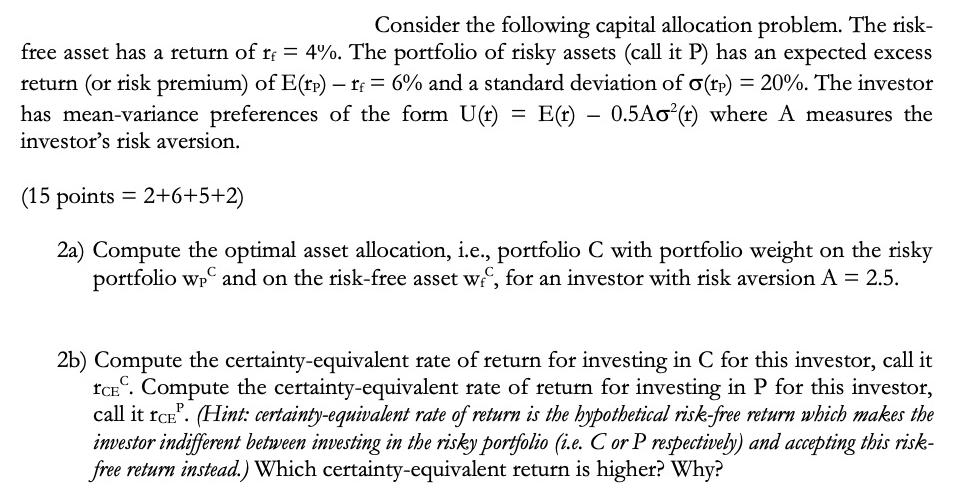
Consider the following capital allocation problem. The risk- free asset has a return of r = 4%. The portfolio of risky assets (call it


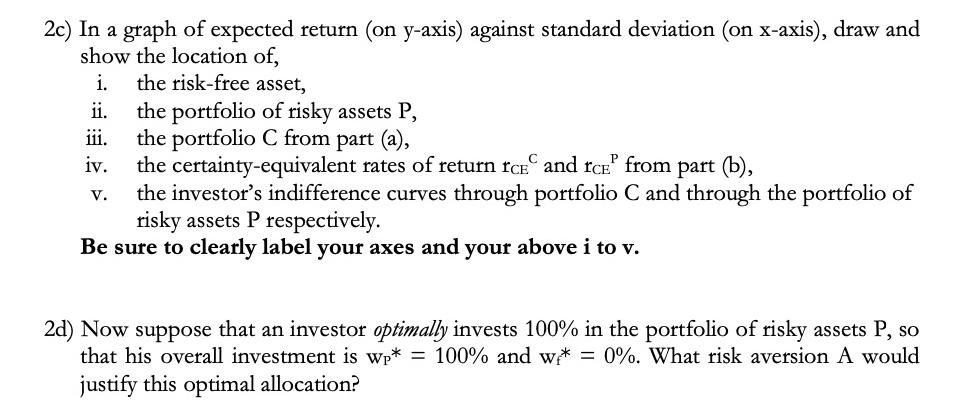
Consider the following capital allocation problem. The risk- free asset has a return of r = 4%. The portfolio of risky assets (call it P) has an expected excess return (or risk premium) of E(rp) - rf = 6% and a standard deviation of o(rp) = 20%. The investor has mean-variance preferences of the form U(r) = E(t) 0.5Ao(r) where A measures the investor's risk aversion. (15 points = 2+6+5+2) 2a) Compute the optimal asset allocation, i.e., portfolio C with portfolio weight on the risky portfolio wp and on the risk-free asset we, for an investor with risk aversion A = 2.5. 2b) Compute the certainty-equivalent rate of return for investing in C for this investor, call it ICE. Compute the certainty-equivalent rate of return for investing in P for this investor, call it ICE. (Hint: certainty-equivalent rate of return is the hypothetical risk-free return which makes the investor indifferent between investing in the risky portfolio (i.e. C or P respectively) and accepting this risk- free return instead.) Which certainty-equivalent return is higher? Why? 2c) In a graph of expected return (on y-axis) against standard deviation (on x-axis), draw and show the location of, i. the risk-free asset, ii. iii. iv. V. the portfolio of risky assets P, the portfolio C from part (a), the certainty-equivalent rates of return rce and ICE from part (b), the investor's indifference curves through portfolio C and through the portfolio of risky assets P respectively. Be sure to clearly label your axes and your above i to v. 2d) Now suppose that an investor optimally invests 100% in the portfolio of risky assets P, so that his overall investment is wp* = 100% and w* = 0%. What risk aversion A would justify this optimal allocation?
Step by Step Solution
★★★★★
3.56 Rating (146 Votes )
There are 3 Steps involved in it
Step: 1
2a To compute the optimal asset allocation for an investor with risk aversion A 25 we can use the meanvariance portfolio optimization framework The op...
Get Instant Access to Expert-Tailored Solutions
See step-by-step solutions with expert insights and AI powered tools for academic success
Step: 2

Step: 3

Ace Your Homework with AI
Get the answers you need in no time with our AI-driven, step-by-step assistance
Get Started


