Answered step by step
Verified Expert Solution
Link Copied!

Question

1 Approved Answer

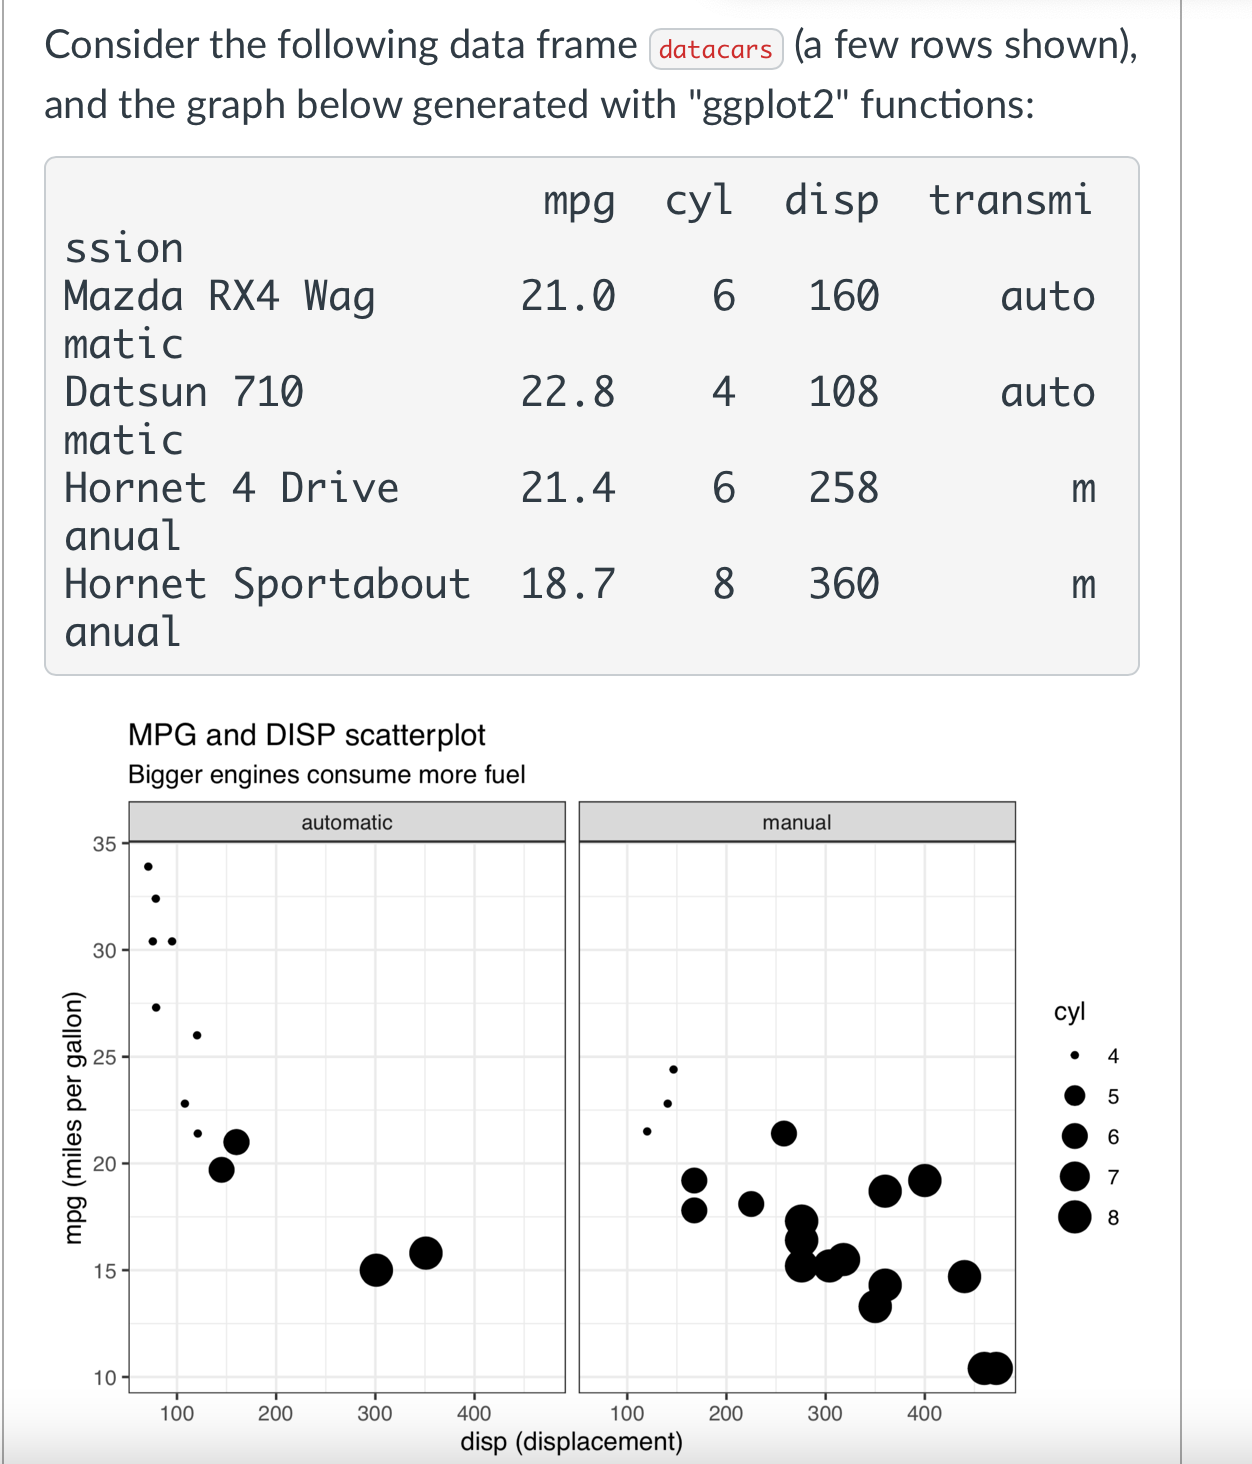
Consider the following data frame datacars (a few rows shown), and the graph below generated with ggplot2 functions: mpg cyl disp transmi ssion Mazda RX4

image text in transcribedimage text in transcribed
Consider the following data frame datacars (a few rows shown), and the graph below generated with "ggplot2" functions: mpg cyl disp transmi ssion Mazda RX4 Wag 21.0 6 160 auto matic Datsun 710 22. 8 4 108 auto matic Hornet 4 Drive 21.4 6 258 m anual Hornet Sportabout 18.7 8 360 m anual MPG and DISP scatterplot Bigger engines consume more fuel automatic manual 35 30 cyl 25 A . . . . mpg (miles per gallon) 20 8 15. 10 100 200 300 400 100 200 300 400 disp (displacement)True or False. a [ Select ] The above plot facets by variable cyl b) [ Select ] The above plot uses geom_scatter() C) [ Select ] Variable cyl is being mapped as size attribute of points d) [ Select ] Variable disp is being mapped to the x-axis e) [ Select ] Variable mpg is being mapped as color attribute of points f) [ Select ] Variable transmission is used as a group aesthetic attribute

Step by Step Solution

There are 3 Steps involved in it

Step: 1

blur-text-image

Get Instant Access to Expert-Tailored Solutions

See step-by-step solutions with expert insights and AI powered tools for academic success

Step: 2

blur-text-image

Step: 3

blur-text-image

Ace Your Homework with AI

Get the answers you need in no time with our AI-driven, step-by-step assistance

Get Started

Recommended Textbook for

Introduction To Probability Models

Authors: Sheldon M Ross

12th Edition

0128143460, 9780128143469

More Books

Students also viewed these Mathematics questions