Answered step by step
Verified Expert Solution
Question
1 Approved Answer
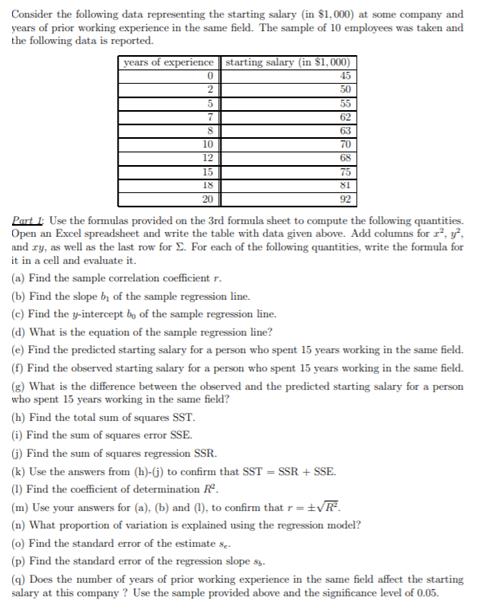
Consider the following data representing the starting salary (in $1,000) at some company and years of prior working experience in the same field. The

Consider the following data representing the starting salary (in $1,000) at some company and years of prior working experience in the same field. The sample of 10 employees was taken and the following data is reported. years of experience starting salary (in $1,000) 45 50 55 62 0 2 5 (h) Find the total sum of squares SST. (i) Find the sum of squares error SSE. 7 8 10 12 15 18 20 63 70 68 75 81 92 Part 1: Use the formulas provided on the 3rd formula sheet to compute the following quantities. Open an Excel spreadsheet and write the table with data given above. Add columns for 2, . and ry, as well as the last row for E. For each of the following quantities, write the formula for it in a cell and evaluate it. (a) Find the sample correlation coefficient r. (b) Find the slope by of the sample regression line. (c) Find the y-intercept by of the sample regression line. (d) What is the equation of the sample regression line? (e) Find the predicted starting salary for a person who spent 15 years working in the same field. (f) Find the observed starting salary for a person who spent 15 years working in the same field. (g) What is the difference between the observed and the predicted starting salary for a person who spent 15 years working in the same field? (j) Find the sum of squares regression SSR. (k) Use the answers from (h)-(j) to confirm that SST = SSR + SSE. (1) Find the coefficient of determination F (m) Use your answers for (a), (b) and (1), to confirm that r= . (n) What proportion of variation is explained using the regression model? (0) Find the standard error of the estimate 8e- (p) Find the standard error of the regression slope s. (q) Does the number of years of prior working experience in the same field affect the starting salary at this company? Use the sample provided above and the significance level of 0.05.
Step by Step Solution
★★★★★
3.36 Rating (152 Votes )
There are 3 Steps involved in it
Step: 1
a Find the sample correlation coefficient r The sample correlation coefficient r is calculated using the following formula r xyx2 y2 Substituting in the values from the data given we have r 45 50 55 6...
Get Instant Access to Expert-Tailored Solutions
See step-by-step solutions with expert insights and AI powered tools for academic success
Step: 2

Step: 3

Ace Your Homework with AI
Get the answers you need in no time with our AI-driven, step-by-step assistance
Get Started


