Answered step by step
Verified Expert Solution
Question
1 Approved Answer
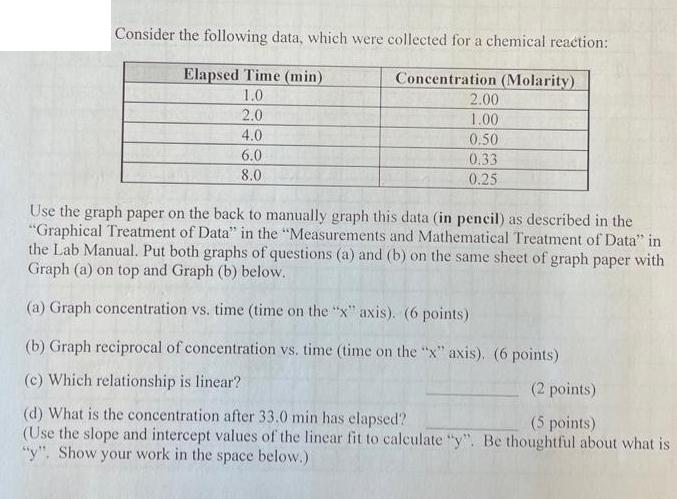
Consider the following data, which were collected for a chemical reaction: Elapsed Time (min) Concentration (Molarity) 1.0 2.0 4.0 6.0 8.0 2.00 1.00 0.50


Consider the following data, which were collected for a chemical reaction: Elapsed Time (min) Concentration (Molarity) 1.0 2.0 4.0 6.0 8.0 2.00 1.00 0.50 0.33 0.25 Use the graph paper on the back to manually graph this data (in pencil) as described in the "Graphical Treatment of Data" in the "Measurements and Mathematical Treatment of Data" in the Lab Manual. Put both graphs of questions (a) and (b) on the same sheet of graph paper with Graph (a) on top and Graph (b) below. (a) Graph concentration vs. time (time on the "x" axis). (6 points) (b) Graph reciprocal of concentration vs. time (time on the "x" axis). (6 points) (c) Which relationship is linear? (2 points) (d) What is the concentration after 33.0 min has elapsed? (5 points) (Use the slope and intercept values of the linear to calculate "y". Be thoughtful about what is "y". Show your work in the space below.)
Step by Step Solution
★★★★★
3.33 Rating (153 Votes )
There are 3 Steps involved in it
Step: 1

Get Instant Access to Expert-Tailored Solutions
See step-by-step solutions with expert insights and AI powered tools for academic success
Step: 2

Step: 3

Ace Your Homework with AI
Get the answers you need in no time with our AI-driven, step-by-step assistance
Get Started


