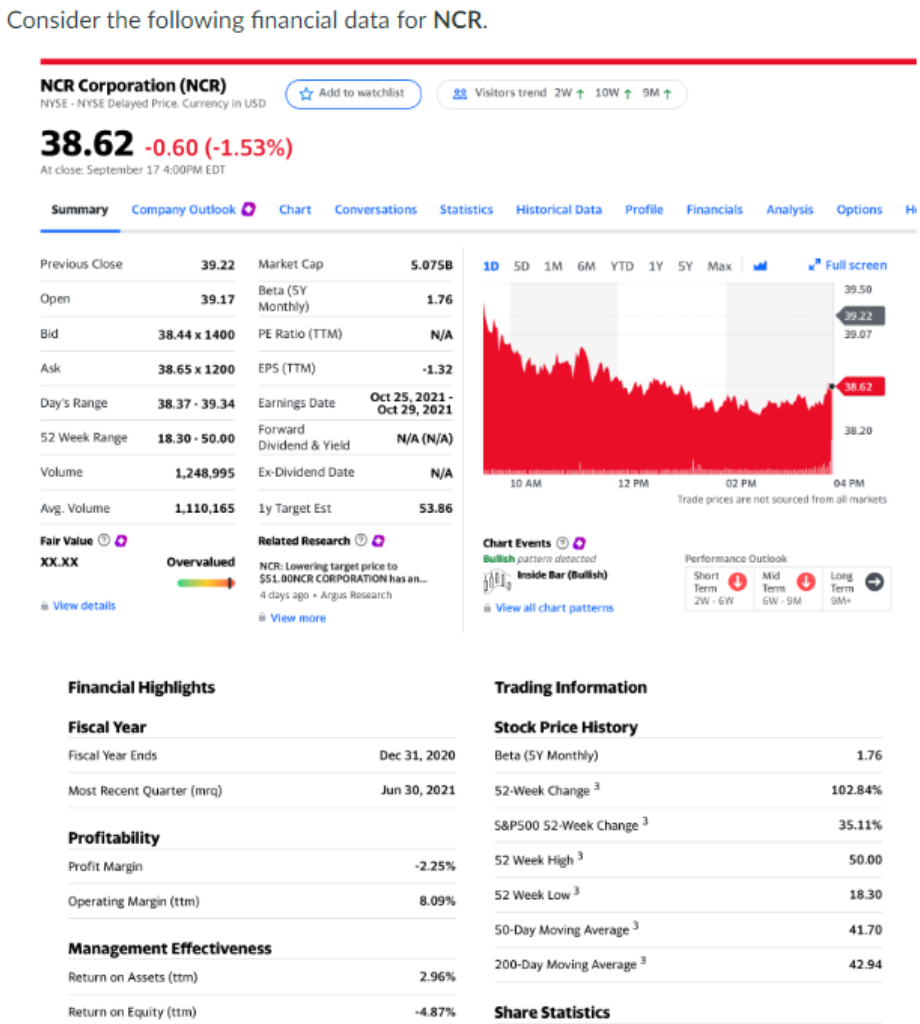
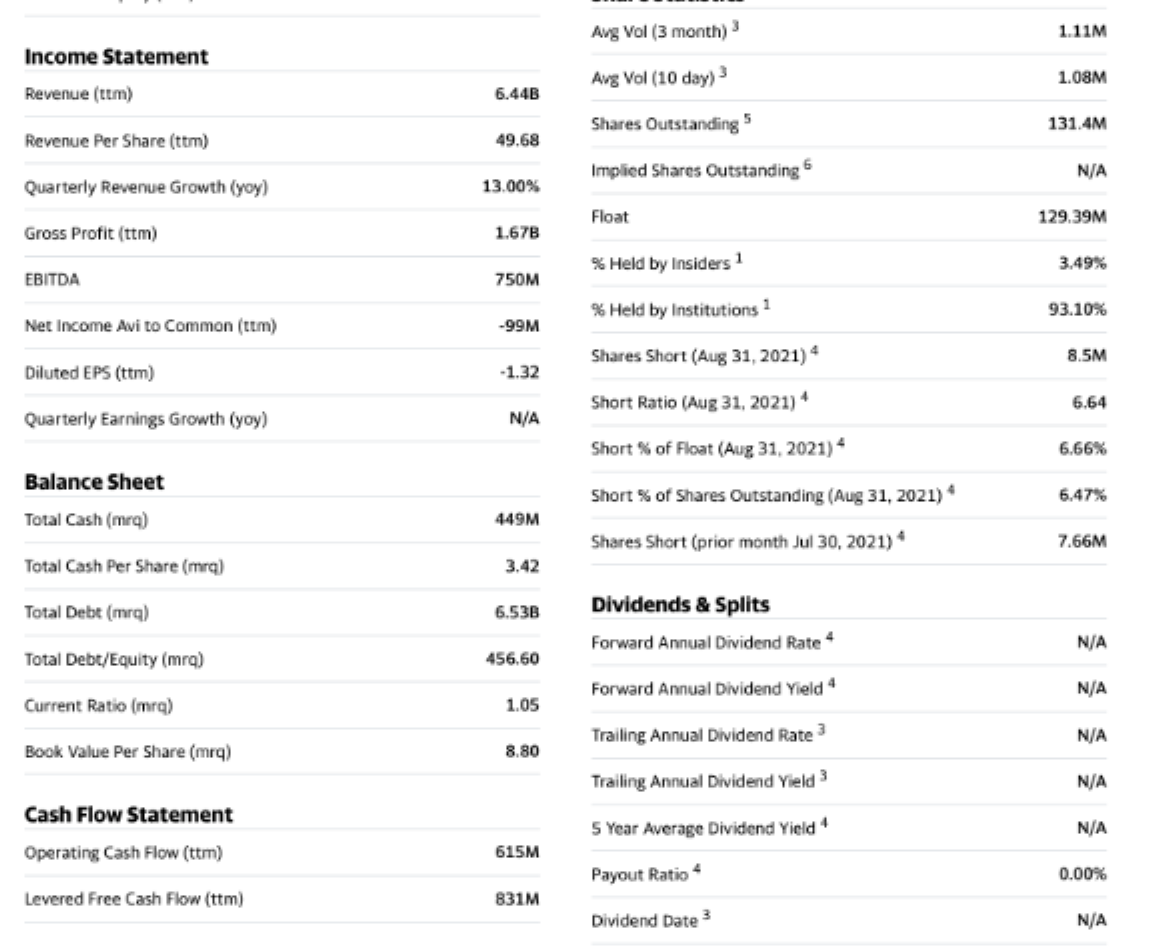
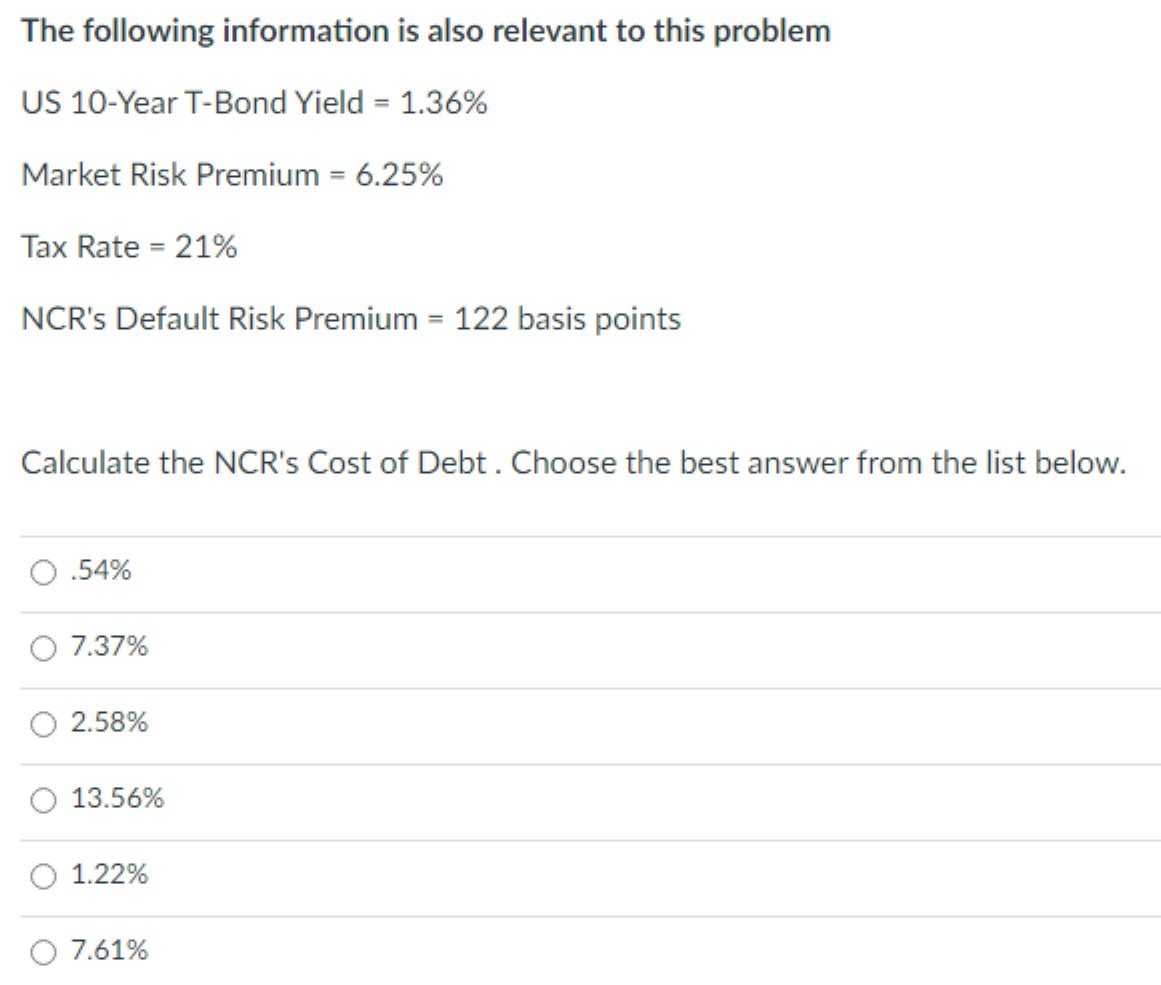
Consider the following financial data for NCR. NCR Corporation (NCR) NYSE - NYSE Delayed Price. Currency in USD Add to watchlist 29 Visitors trend 2W + 10W + 9M + 38.62 -0.60 (-1.53%) At close: September 17 4:00PM EDT Summary Company Outlook Chart Conversations Statistics Historical Data Profile Financials Analysis Options H Previous Close 39.22 5.075B 1D 5D 1M 6M YTD 1y5Y Max Full screen 39.50 Open 39.17 Market Cap Beta (5Y Monthly) PE Ratio (TTM) 1.76 39.22 39.07 Bid 38.44 x 1400 N/A Ask 38.65 x 1200 EPS (TTM) -1.32 38,62 Day's Range 38.37. 39.34 Oct 25, 2021- Oct 29, 2021 38.20 52 Week Range 18.30 - 50.00 Earnings Date Forward Dividend & Yield Ex-Dividend Date N/A (N/A) Volume 1,248,995 N/A 10 AM 12 PM 02 PM 04 PM Trade prices are not sourced from all markets Avg. Volume 1,110,165 1y Target Est 53.86 Fair Value XX.XX Overvalued Related Research NCR:Lowering target price to $51.00NCR CORPORATION has an.. 4 days ago Argus Research View more Chart Events Bullish pattern detected hou, Inside Bar (Bullish) Performance Outlook Short a Mid Term Term 2W6W 6W9M Long Term SM . View details View all chart patterns Financial Highlights Trading Information Fiscal Year Fiscal Year Ends Dec 31, 2020 1.76 Most Recent Quarter (mra) Jun 30, 2021 Stock Price History Beta (5Y Monthly) 52-Week Change S&P500 52-Week Change 3 52 Week High 102.84% 35.11% Profitability Profit Margin -2.25% 50.00 18.30 52 Week Low 8.09% Operating Margin(tm) 50-Day Moving Average 41.70 Management Effectiveness Return on Assets (ttm) 200-Day Moving Average 42.94 2.96% Return on Equity (ttm) -4.87% Share Statistics Ang Vol (3 month) 1.11M Income Statement Avg Vol (10 day) 1.08M Revenue (tum) 6.44B Shares Outstanding 5 131.4M Revenue Per Share (ttm) 49.68 6 Implied Shares Outstanding N/A Quarterly Revenue Growth (yoy) 13.00% Float 129.39M Gross Profit (tm) 1.67B % Held by Insiders 1 3.49% EBITDA 750M % Held by Institutions 1 93.10% Net Income Avi to Common (tum) -99M Shares Short (Aug 31, 2021) 8.5M Diluted EPS (ttm) -1.32 Short Ratio (Aug 31, 2021) 6.64 Quarterly Earnings Growth (yoy) N/A Short % of Float (Aug 31, 2021) 6.66% Balance Sheet Short % of Shares Outstanding (Aug 31, 2021) 6.47% Total Cash (mra) 449M Shares Short (prior month Jul 30, 2021) 7.66M Total Cash Per Share (mra) 3.42 6.53B Dividends & Splits Forward Annual Dividend Rate N/A 456.60 Total Debt (mra) Total Debt/Equity (mra) Current Ratio (mra) Book Value Per Share (mra) Forward Annual Dividend Yield N/A 1.05 Trailing Annual Dividend Rate 3 N/A 8.80 Trailing Annual Dividend Yield N/A Cash Flow Statement Operating Cash Flow (ttm) 5 Year Average Dividend Yield" N/A 615M Payout Ratio 4 0.00% Levered Free Cash Flow (ttm) 831M Dividend Date N/A The following information is also relevant to this problem US 10-Year T-Bond Yield = 1.36% Market Risk Premium = 6.25% Tax Rate = 21% NCR's Default Risk Premium = 122 basis points Calculate the NCR's Cost of Debt. Choose the best answer from the list below. .54% O 7.37% 2.58% 13.56% 1.22% 7.61%