Answered step by step
Verified Expert Solution
Question
1 Approved Answer
Consider the following graph on the interval-300 < x < 135: -270-240 -210 -180 -150-120 -90-60 -30 1. What is the amplitude of the
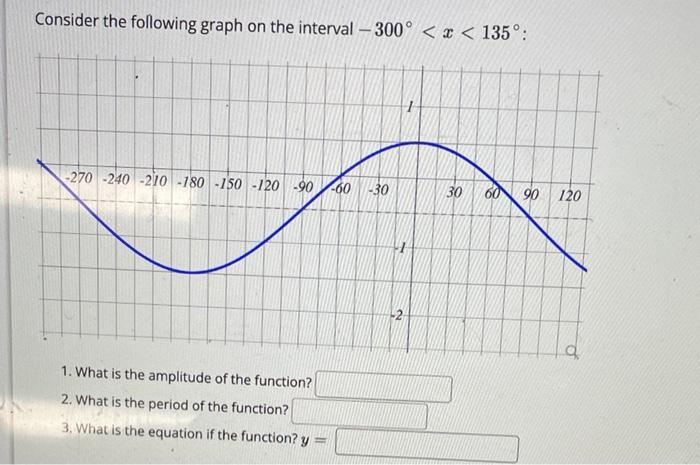
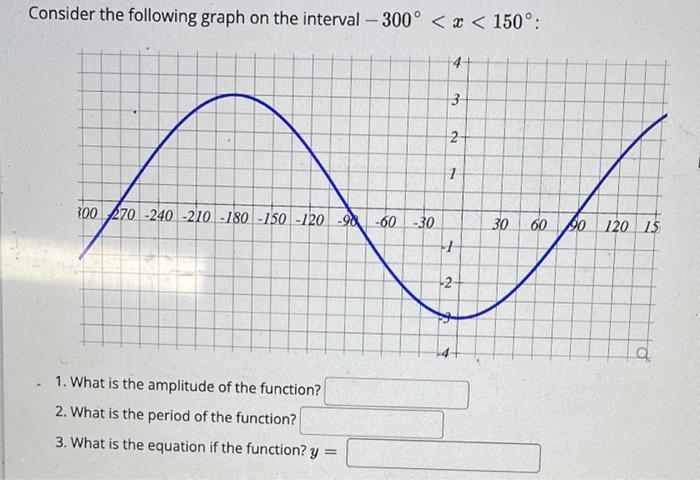
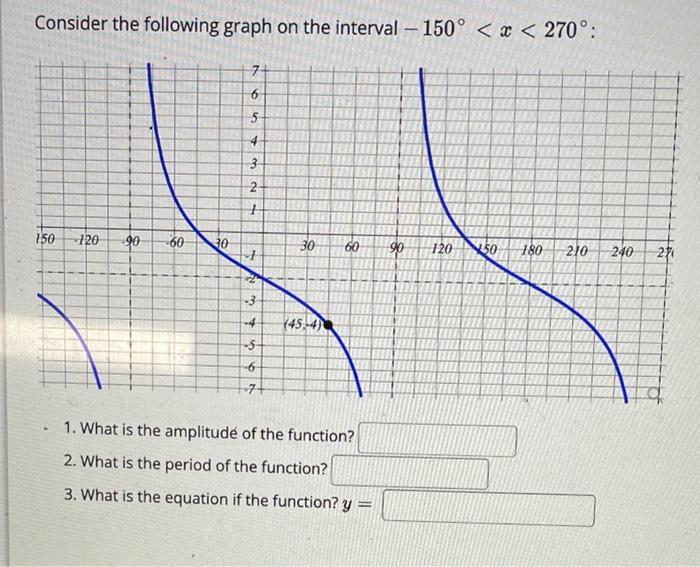
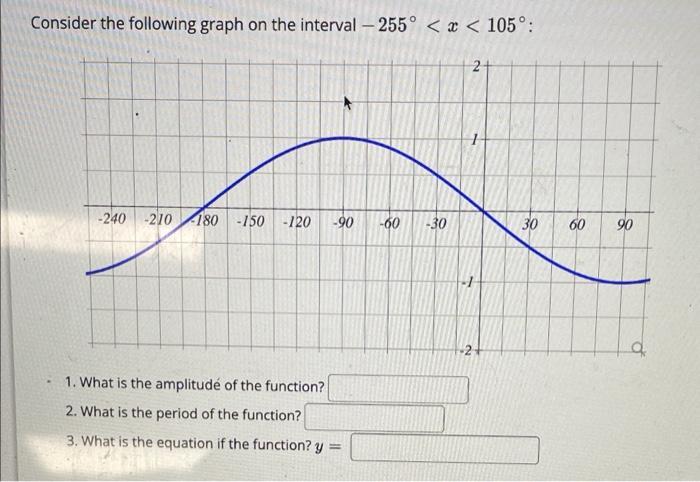
Consider the following graph on the interval-300 < x < 135: -270-240 -210 -180 -150-120 -90-60 -30 1. What is the amplitude of the function? 2. What is the period of the function? 3. What is the equation if the function? y 2 30 60 90 120 a Consider the following graph on the interval - 300 < x < 150: . 300 270-240 -210-180-150-120 -98 -60 -30 1. What is the amplitude of the function? 2. What is the period of the function? 3. What is the equation if the function? y 4 3 2 1 - -2 30 60 90 120 15 Consider the following graph on the interval - 150 < x < 270: 150 -120 90 60 30 7 6 5 4 3 2 + 1 2 NM -3 -4 -S -6 7+ LED 12 HE PEDERSE II ELFRIE 30 (45-4) 60 90 1. What is the amplitude of the function? 2. What is the period of the function? 3. What is the equation if the function? y = 120 TEATED HE FR 50 1740 180 210 240 27 Consider the following graph on the interval-255 < x < 105: -240 -210 180 -150 -120 -90 -60 1. What is the amplitude of the function? 2. What is the period of the function? 3. What is the equation if the function? y = -30 2 1 30 60 90 q
Step by Step Solution
★★★★★
3.55 Rating (159 Votes )
There are 3 Steps involved in it
Step: 1
First graph Amplitude is the maximum value minus the minimum value over one period Looking at the g...
Get Instant Access to Expert-Tailored Solutions
See step-by-step solutions with expert insights and AI powered tools for academic success
Step: 2

Step: 3

Ace Your Homework with AI
Get the answers you need in no time with our AI-driven, step-by-step assistance
Get Started


