Question
Consider the following graph reporting the traditional risk-return framework: 1. What kind of portfolios (including M) are represented on the envelope on top of the
Consider the following graph reporting the traditional risk-return framework:
1. What kind of portfolios (including M) are represented on the envelope on top of the cloud of points on the graph? 2. Suppose you would choose the portfolio on the Capital Market Line that corresponds to the one located to the left of portfolio M, provide an example of a performance measure that would associate a lower value of portfolio M than to your equilibrium portfolio. 3. Draw a numerical example of your answer to sub-question 2 above 4. What do the two convex lines on top of the graph represent? 5. Please provide a performance measure that faithfully translates the dimension represented by these lines. 6. On the basis of this performance measure and your own investor profile, to what portfolio involving an investment in the market portfolio do you assign the highest performance: the one that involves lending, or the one that involves borrowing? Represent graphically your reasoning. 7. Morningstar uses a similar concept for the attribution of its stars. Briefly explain the concept of Morningstar Risk-Adjusted Return.
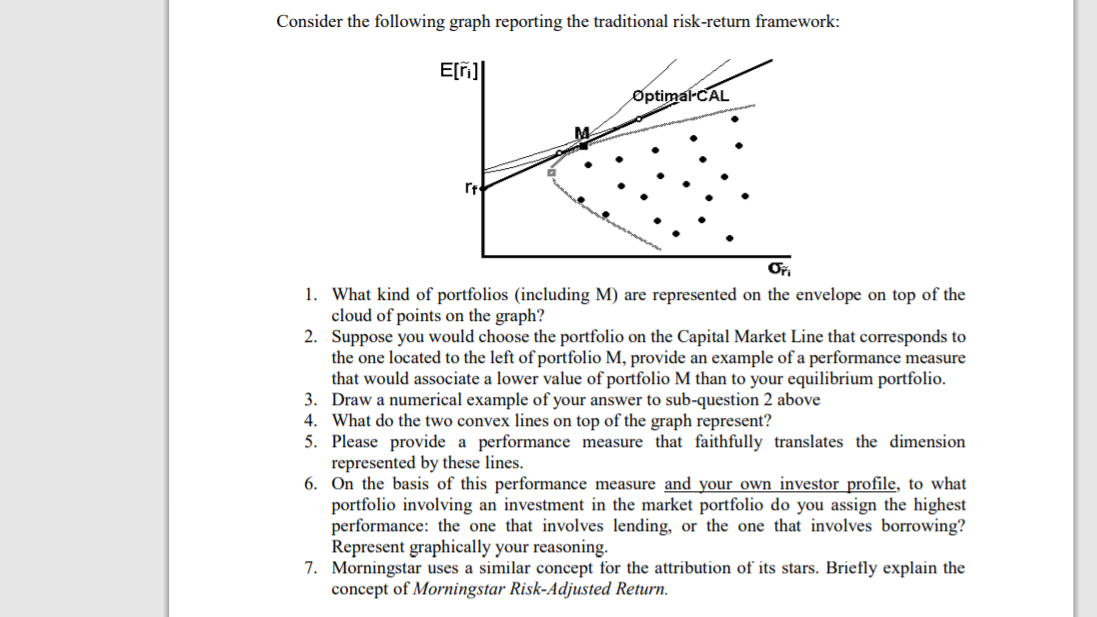
Consider the following graph reporting the traditional risk-return framework: E[] Optimal-CAL 1. What kind of portfolios (including M) are represented on the envelope on top of the cloud of points on the graph? 2. Suppose you would choose the portfolio on the Capital Market Line that corresponds to the one located to the left of portfolio M, provide an example of a performance measure that would associate a lower value of portfolio M than to your equilibrium portfolio. 3. Draw a numerical example of your answer to sub-question 2 above 4. What do the two convex lines on top of the graph represent? 5. Please provide a performance measure that faithfully translates the dimension represented by these nes. 6. On the basis of this performance measure and your own investor profile, to what portfolio involving an investment in the market portfolio do you assign the highest performance: the one that involves lending, or the one that involves borrowing? Represent graphically your reasoning. 7. Morningstar uses a similar concept for the attribution of its stars. Briefly explain the concept of Morningstar Risk-Adjusted Return. Consider the following graph reporting the traditional risk-return framework: E[] Optimal-CAL 1. What kind of portfolios (including M) are represented on the envelope on top of the cloud of points on the graph? 2. Suppose you would choose the portfolio on the Capital Market Line that corresponds to the one located to the left of portfolio M, provide an example of a performance measure that would associate a lower value of portfolio M than to your equilibrium portfolio. 3. Draw a numerical example of your answer to sub-question 2 above 4. What do the two convex lines on top of the graph represent? 5. Please provide a performance measure that faithfully translates the dimension represented by these nes. 6. On the basis of this performance measure and your own investor profile, to what portfolio involving an investment in the market portfolio do you assign the highest performance: the one that involves lending, or the one that involves borrowing? Represent graphically your reasoning. 7. Morningstar uses a similar concept for the attribution of its stars. Briefly explain the concept of Morningstar Risk-Adjusted ReturnStep by Step Solution
There are 3 Steps involved in it
Step: 1
Get Instant Access to Expert-Tailored Solutions
See step-by-step solutions with expert insights and AI powered tools for academic success
Step: 2
Step: 3
Ace Your Homework with AI
Get the answers you need in no time with our AI-driven, step-by-step assistance
Get Started