Question
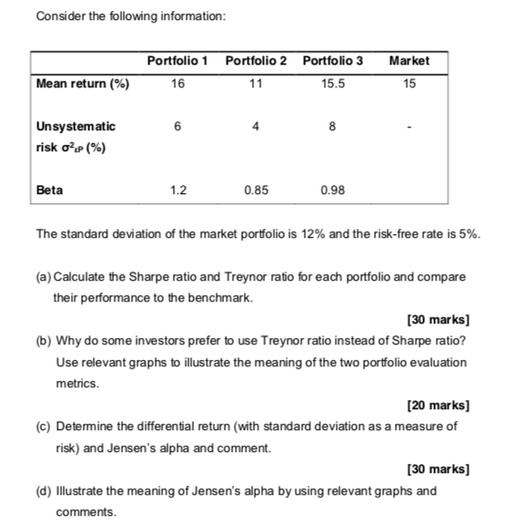
Consider the following information: Portfolio 1 Portfolio 2 Portfolio 3 Market Mean return (%) 16 11 15.5 15 Unsystematic 6 8 risk (%) Beta

Consider the following information: Portfolio 1 Portfolio 2 Portfolio 3 Market Mean return (%) 16 11 15.5 15 Unsystematic 6 8 risk (%) Beta 1.2 0.85 0.98 The standard deviation of the market portfolio is 12% and the risk-free rate is 5%. (a) Calculate the Sharpe ratio and Treynor ratio for each portfolio and compare their performance to the benchmark. [30 marks] (b) Why do some investors prefer to use Treynor ratio instead of Sharpe ratio? Use relevant graphs to illustrate the meaning of the two portfolio evaluation metrics. [20 marks] (c) Determine the differential return (with standard deviation as a measure of risk) and Jensen's alpha and comment. [30 marks] (d) Illustrate the meaning of Jensen's alpha by using relevant graphs and comments.
Step by Step Solution
There are 3 Steps involved in it
Step: 1

Get Instant Access to Expert-Tailored Solutions
See step-by-step solutions with expert insights and AI powered tools for academic success
Step: 2

Step: 3

Ace Your Homework with AI
Get the answers you need in no time with our AI-driven, step-by-step assistance
Get StartedRecommended Textbook for
Fundamentals of Financial Management
Authors: Eugene F. Brigham
Concise 9th Edition
1305635937, 1305635930, 978-1305635937
Students also viewed these Finance questions
Question
Answered: 1 week ago
Question
Answered: 1 week ago
Question
Answered: 1 week ago
Question
Answered: 1 week ago
Question
Answered: 1 week ago
Question
Answered: 1 week ago
Question
Answered: 1 week ago
Question
Answered: 1 week ago
Question
Answered: 1 week ago
Question
Answered: 1 week ago
Question
Answered: 1 week ago
Question
Answered: 1 week ago
Question
Answered: 1 week ago
Question
Answered: 1 week ago
Question
Answered: 1 week ago
Question
Answered: 1 week ago
Question
Answered: 1 week ago
Question
Answered: 1 week ago
Question
Answered: 1 week ago
Question
Answered: 1 week ago
Question
Answered: 1 week ago
Question
Answered: 1 week ago
View Answer in SolutionInn App


